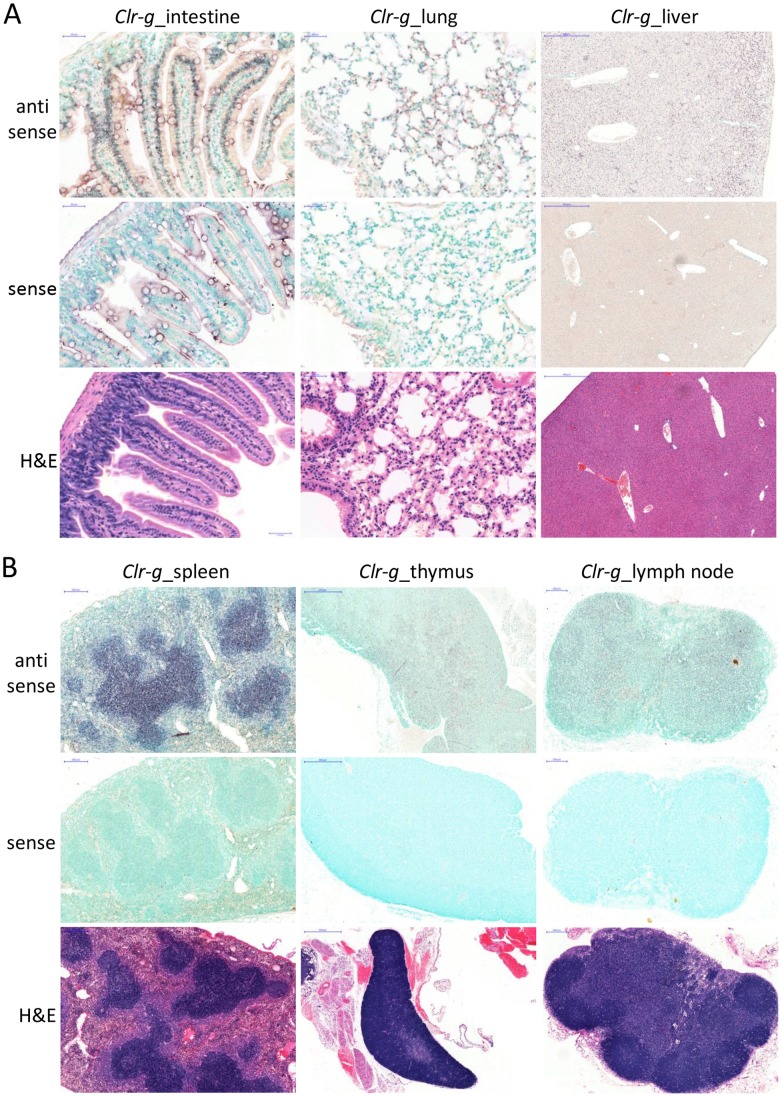
Figure 10. Lymphoid and non-lymphoid cell expression of Clr-g.
Paraffin-embedded tissue sections of the (A) small intestine (jejunum), lung, and liver, and (B) spleen, thymus, and inguinal lymph node were prepared from a PBS-perfused B6 mouse followed by hybridization with DIG-labeled sense (control) or anti-sense RNA probes. Hybridization was visualized with an alkaline phosphatase-conjugated anti-DIG mAb followed by a (brown) color substrate. An H&E stain of a subsequent tissue section is provided to visualize organ architecture. The scale bars of each tissue section are as indicated for the previous figures.

