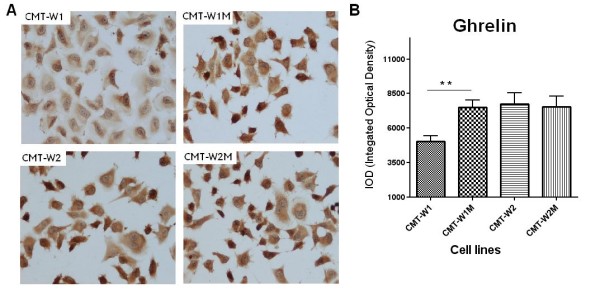
Figure 5.

Ghrelin expression in canine mammary carcinoma cell lines. (A) Representative pictures of canine mammary adenocarcinoma cell lines (CMT-W1, CMT-W2) and their lung metastases (CMT-W1M and CMT-W2M). The majority of the cancer cells showed a strong cytoplasmic staining reaction (brown color) of ghrelin (anti-pre proghrelin antibody obtained from Abcam, UK was used). Pictures were obtained with Olympus BX60 microscope (at the magnification of x20). (B) The graph of integrated optical density (IOD) of the ghrelin-positive cells in examined canine cancer cell lines. The colorimetric intensity of the IHC-stained antigen spots was evaluated by a computer-assisted image analyzer (Olympus Microimage™ Image Analysis, software version 5.0 for windows, USA). Twenty pictures in each slide were analyzed. The results are presented as a mean (±SEM) from tree separate experiments. The statistical analysis was performed using Prism version 5.00 software (GraphPad Software,USA). The one-way ANOVA and unpaired t-test were applied. p < 0.01 was regarded as significant and marked as **.
