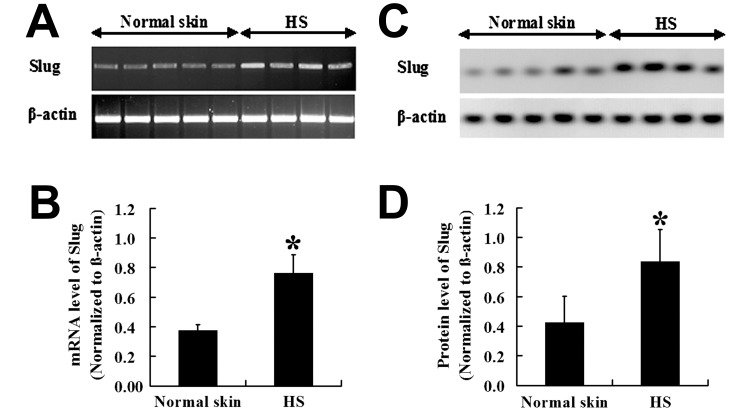
Figure 2. mRNA expression of Slug in HS and normal skin tissues.
mRNA expression of Slug was increased in HS ( = 0.76, s = 0.13, n = 4) compared to normal skin (
 = 0.38, s = 0.04, n = 5) (A) and (B). Similar to the change of Slug mRNA level, western blot (C) and graphic analysis (D) showed that Slug was significantly increased in HS (
 = 0.84, s = 0.22, n = 4) than that in normal skin (
 = 0.42, s = 0.18, n = 5). * P<0.01.

