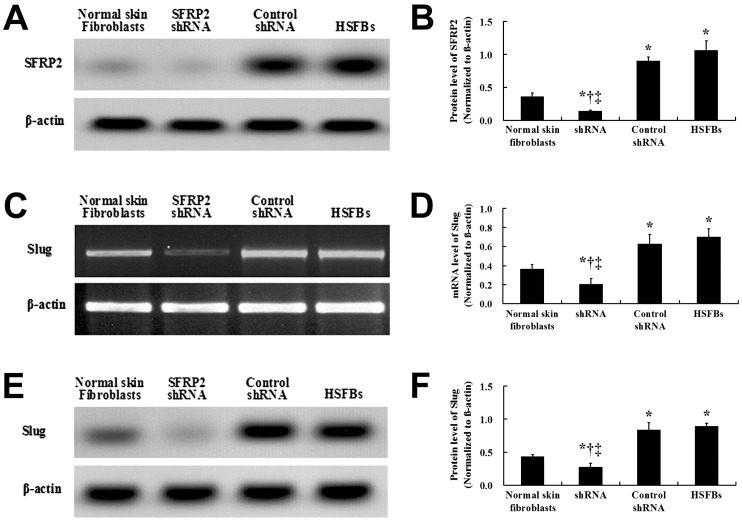
Figure 4. Effects of SFRP2 shRNA on the protein expression of SFRP2 and Slug in HSFBs.
The SFRP2 protein level was significantly increased and decreased in the non- transfected HSFBs ( = 1.06, s = 0.15) and the SFRP2 shRNA group (
 = 0.14, s = 0.02), respectively, compared with the normal skin fibroblasts (
 = 0.36, s = 0.05). And the protein expression of SFRP2 in HSFBs transfected with control shRNA (
 = 0.90, s = 0.06) was not significantly decreased than that in non-transfected HSFBs. After the treatments of the shRNAs, the SFRP2 protein level was significantly lower than that in the HSFBs and the HSFBs transfected with control shRNA (A and B). Similar to the effects on the expression of SFRP2, Slug expression was significantly higher in the non- transfected HSFBs and HSFBs transfected with control shRNA than that in normal skin fibroblasts both in mRNA (
 = 0.70, s = 0.08;
  = 0.63, s = 0.10;
  = 0.37, s = 0.05, respectively) and protein levels (
 = 0.90, s = 0.04;
  = 0.84, s = 0.11;
  = 0.43, s = 0.04, respectively). Moreover, both the Slug mRNA and protein levels were significantly decreased in HSFBs transfected with SFRP2 shRNA (
 = 0.20, s = 0.06;
  = 0.25, s = 0.05, respectively) compared with the non- transfected HSFBs and HSFBs transfected with control shRNA (B- F). *: P<0.01 versus Normal skin fibroblast; †: P<0.01 versus Control shRNA; ‡: P<0.01 versus HSFBs.

