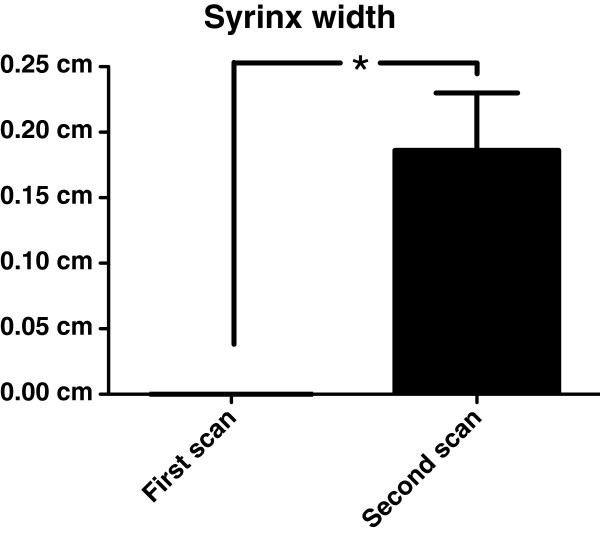
Figure 1.
Progression of syrinx width. Bar graph displaying distribution of syrinx width for first and second scans. There was a statistically significant difference in syrinx maximal transverse width between first and second scans (0.08cm ± 0.14cm vs 0.18cm ± 0.16cm, p=0.01). Bar represents mean (SD), * represents P<0.05.

