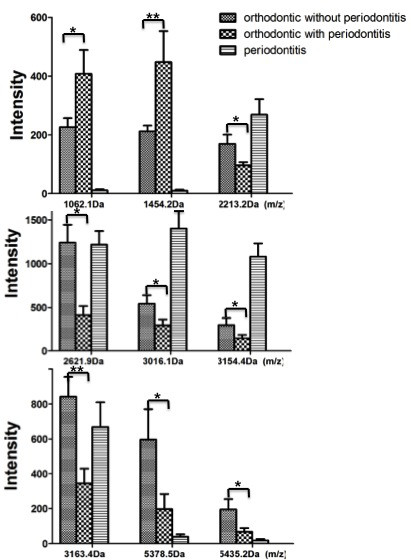
Figure 2.

Column view of the mass spectra of the three groups. The peak intensities of the three different groups showed differential expression of nine salivary peptides. Noticeably, significant differences were investigated between the two orthodontic groups. (*p <0.05; **p <0.01).
