Figure 4.

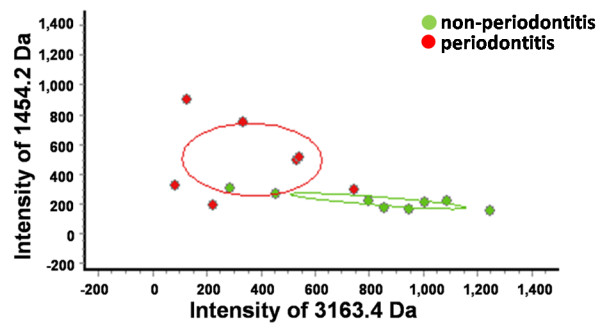
Scatter plots of the two groups generated by combining the 3163.4-Da and 1454.2-Da proteins. The scatter plots showed a well-fitting curve.

Scatter plots of the two groups generated by combining the 3163.4-Da and 1454.2-Da proteins. The scatter plots showed a well-fitting curve.