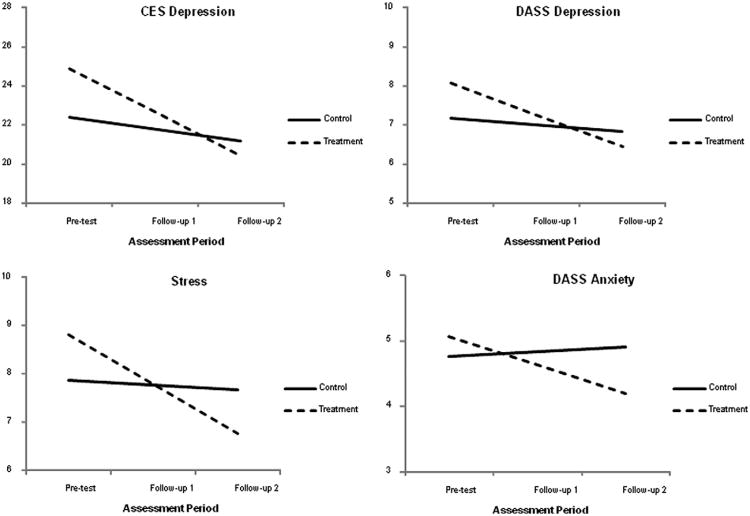
Fig. 7.
Simple slopes for the CES-D and DASS scales. The graphs suggest that the amount of time between pretest and follow-up 1 was identical to the time between follow-up 1 and follow-up 2, which it was not. The growth curve analyses modeled change as a function of the square root of time since pretest. This transformation effectively equated the amount of elapsed time between the 2 pairs of assessments. Although the graphs suggest that change was constant, the greatest changes occurred between pretest and follow-up 1. However, this transformation does not affect the end-point differences (ie, the vertical separation of the simple slopes at follow-up 2).

