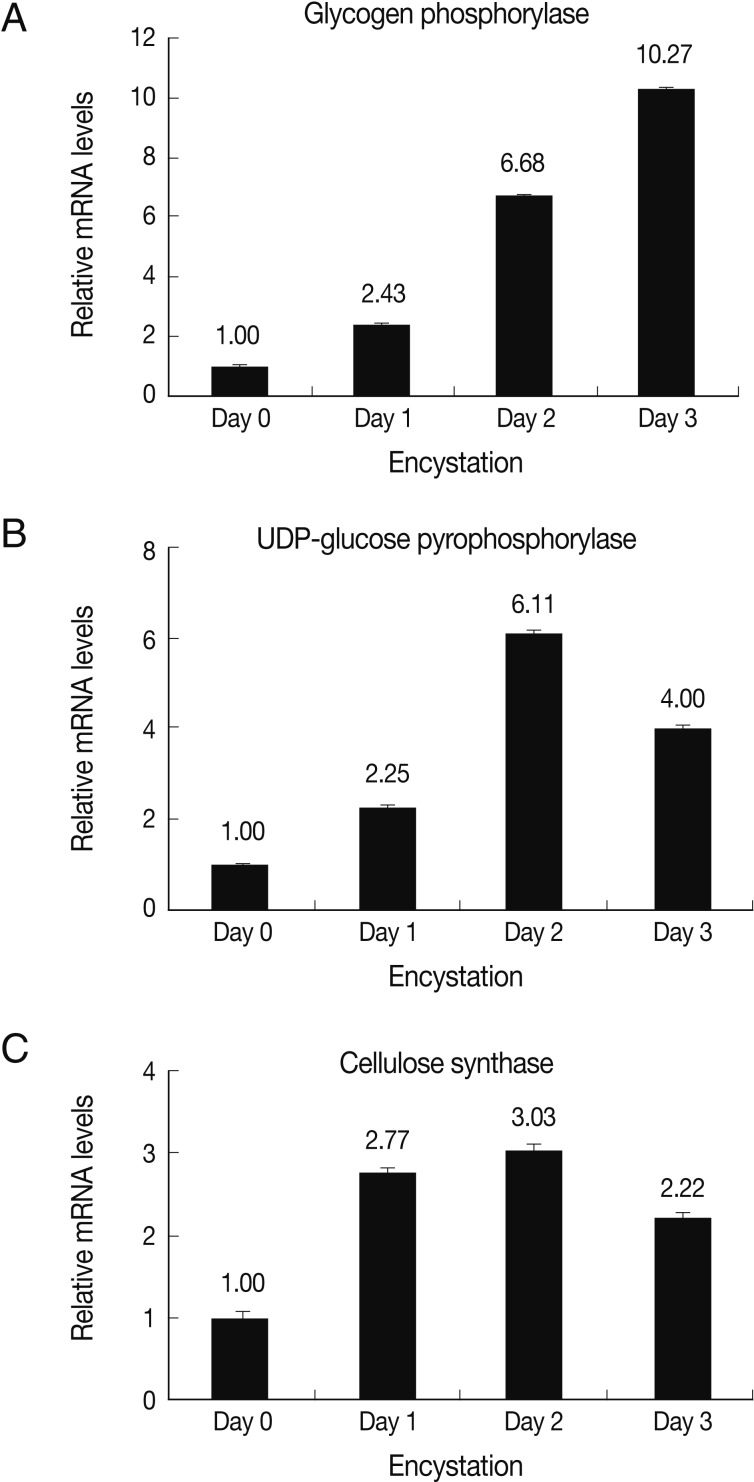
Fig. 3.
Real-time PCR analysis of 3 enzymes during encystation. (A) An increase in levels of expression of glycogen phosphorylase was observed on Day 1 (2.4-fold), Day 2 (6.7-fold), and Day 3 (10.3-fold). (B) High expression of UDP-glucose pyrophosphorylase on Day 1 (2.3-fold), Day 2 (6.1-fold), and Day 3 (4.0-fold). (C) Cellulose synthesis showed high levels of expression on Day 1 (2.8-fold), Day 2 (3.0-fold), and Day 3 (2.2-fold).

