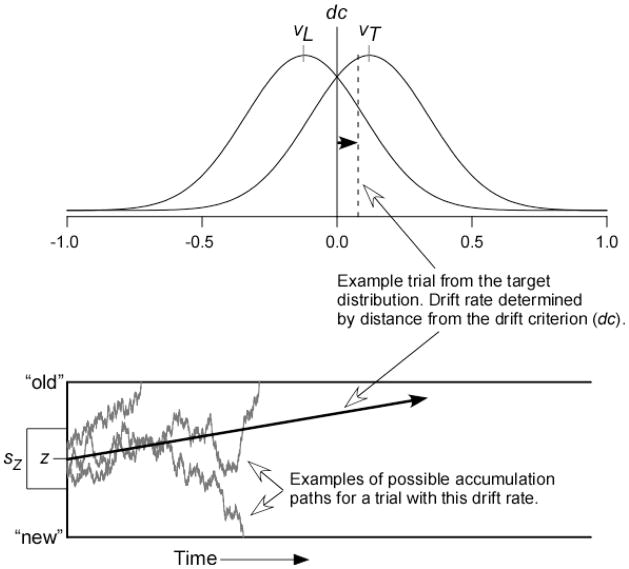
Figure 1.
The diffusion model for two-choice responding. The top panel shows distributions of drift rates across test trials for both targets (mean = vT) and lures (mean = vL). The vertical line is the drift criterion (dc), and the drift rate on each trial is determined by the distance between the drift criterion and a sample from the drift distribution, as shown with the dashed line. The bottom panel shows three examples of accumulation paths for a trial with the sampled drift rate. The starting point of accumulation is a random draw from a uniform distribution with mean z and range sZ. Paths terminating on the top boundary lead to “old” responses, and paths terminating on the bottom boundary lead to “new” responses.

