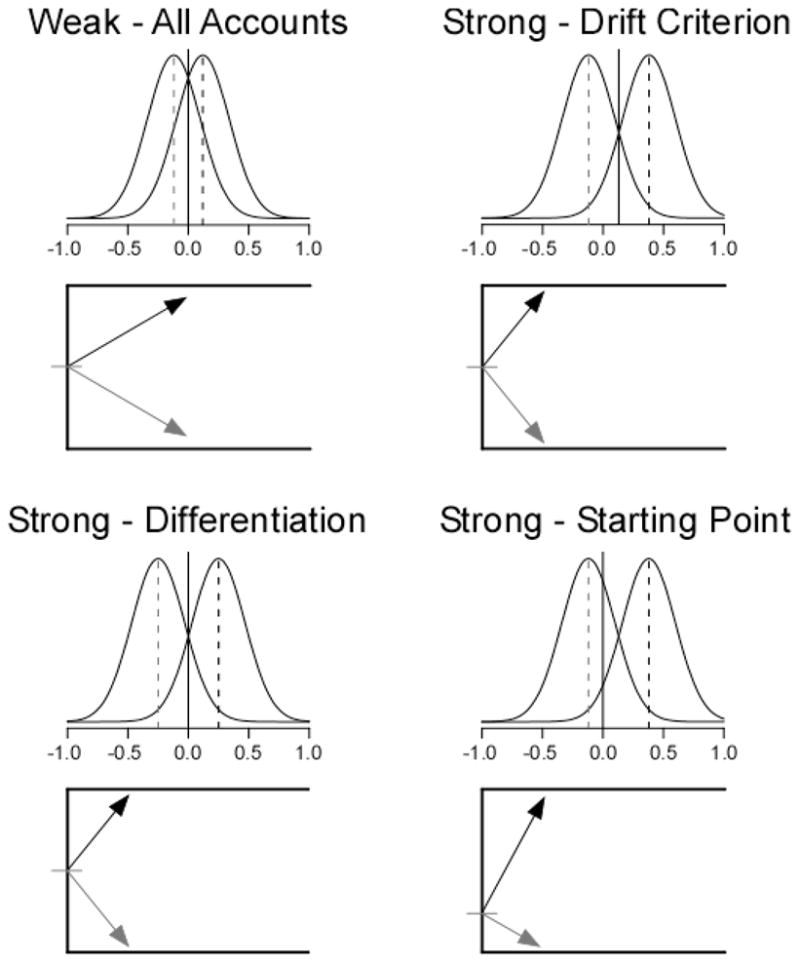
Figure 2.

Possible mechanisms for the SBME in the diffusion model. The top left panel shows example parameters from a weak list, and the remaining panels show parameters from a strong list under the differentiation (bottom left), drift criterion (top right), and starting point (bottom right) accounts. The distributions in each panel are the drift distributions, with the mean of the lure distribution marked with a gray dashed line and the target mean marked with a black dashed line. The solid vertical line is the drift criterion. The bottom panel shows the average drift rates for targets and lures based on the distance of each drift distribution from the drift criterion. See the text for detailed discussion of the different accounts.
