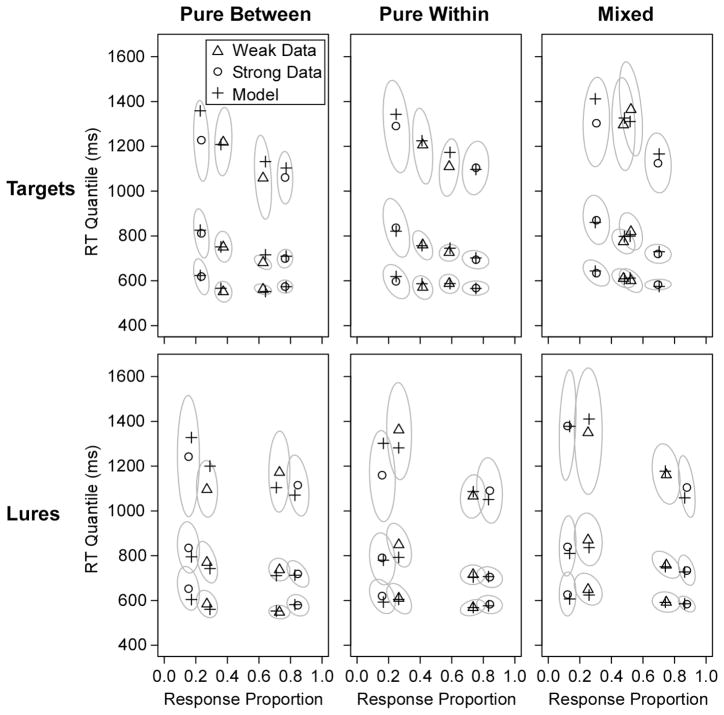
Figure 4.
Quantile-probability plots for group data from Experiment 1 with the predicted points of the best-fitting diffusion model (predictions are from the fits with both lure drift and starting point varying across strength). The sets of 3 points are the .1, .5, and .9 quantiles of the RT distributions, and they are plotted on x-values equal to the probability of the response (the .3 and .7 quantiles were also fit, but they are omitted from the plot to avoid clutter). The gray ovals show 95% confidence ellipses estimated with a bootstrap procedure (Efron & Tibshirani, 1985). For the bootstraps, 500 simulated datasets were created by randomly sampling participants with replacement, and response proportions and RT quantiles were calculated for each simulated dataset. The plot shows the smallest ellipses that contained 95% of the points across the bootstrap runs.

