Figure 2.
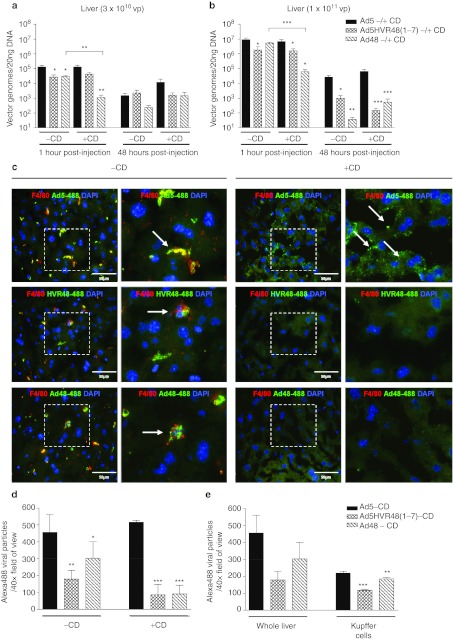
Detection of virus in the liver by quantitative PCR (qPCR) and immunofluorescence. (a) MF1 mice were injected intravascularly (i.v.) with 3 × 10¹⁰ virus particles (vp) Ad5, Ad5HVR48(1-7), or Ad48 and livers harvested for analysis (1 hour and 48 hours). Animals were pretreated with 200 µl phosphate-buffered saline (PBS) (–CD) or clodronate liposomes (+CD) 48 hours prior. Genomes were detected by real-time qPCR. (b) Quantification of viral genomes in the liver following i.v. injection of 1 × 10¹¹ vp. Data represent the mean ± SEM (n = 5–8 per group), ***P < 0.001, **P < 0.01, *P < 0.05. Significance indicators directly above histogram bars indicate comparison to Ad5, within same +CD treatment group. (c) Immunofluorescence detection of Alexa-488-labeled virus in the liver 1 hour postinjection of 1 × 10¹¹ vp (+CD). Kupffer cells (KCs) were identified by F4/80+ staining (red) and Ad5-488, Ad5HVR48(1-7)-488 (abbreviated to HVR48-488 in figure) or Ad48-488 are shown in green. Nuclei were counterstained with DAPI (blue). Right hand columns of each treatment group represent magnifications of the boxed areas (outlined in white). Images are representative of multiple fields of view from different animals. White arrows indicate virus within KCs (–CD) or on the surface of hepatocytes (+CD). (d) Quantification of Alexa-488 in liver images. A total of 6–15 separate images from different animals (n = 3 animals/group; mean ± SD) were thresholded, analyzed and regions corresponding to Alexa-488-labeled virus quantified using ImageJ analysis software. (e) Quantification of Alexa-488 within KCs in liver images. KCs (F4/80+) were manually segmented and the amount of Alexa-488 within summed using ImageJ software (average number of KCs = 14 per image). Graphical representation of whole liver in e is the same as –CD in d, for ease of comparison (n = 3 animals/group; mean ± SD). HVR, hypervariable region.

