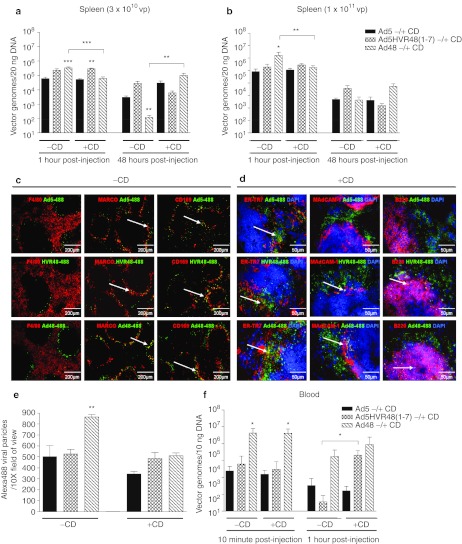
Figure 3.
Detection of virus in the spleen by quantitative PCR (qPCR) and immunofluorescence. (a) MF1 mice were injected intravascularly (i.v.) with 3 × 10¹⁰ virus particles (vp) Ad5, Ad5HVR48(1-7), or Ad48 and spleens harvested for analysis (1 hour and 48 hours). Animals were pretreated with 200 µl phosphate-buffered saline (PBS) (–CD) or clodronate liposomes (+CD) 48 hours before virus delivery and genomes detected by qPCR. (b) Quantification of viral genomes in the spleen following i.v. injection of 1 × 10¹¹ vp. Data represent the mean ± SEM (n = 5–8 per group), ***P < 0.001, **P < 0.01, *P < 0.05. *Significance indicators directly above histogram bars indicate comparison to Ad5, within same CD treatment group. (c) Immunofluorescence detection of Alexa-488-labeled virus (1 × 10¹¹ vp) in the spleen (1 hour). Note: Alexa-488 labeled Ad5HVR48(1-7) is abbreviated to HVR48-488 in figure. Spleen sections were stained for F4/80, MARCO or CD169 (red) and images captured under a ×10 objective (–CD). (d) Markers to cell types which are unaffected by macrophage-depletion (B220, ER-TR7, MAdCAM-1) were used for colocalization. Images shown were captured using a ×40 objective and are representative of multiple fields of view (n = 3 animals/group; mean ± SD). Areas of colocalization are indicated by white arrows. (e) Quantification of Alexa-488 in spleen sections. A total of 6–10 separate images from different animals were analyzed (×10 magnification) and regions corresponding to Alexa-488-labeled virus quantified using ImageJ analysis (n = 3 animals/group; mean ± SD). (f) Quantification of viral genomes from blood 10 minutes and 1 hour postinjection of 1 × 10¹¹ vp by qPCR, using 10 ng total DNA for analysis (n = 5–8 animals/group; mean ± SEM), *P < 0.05. Significance indicators directly above histogram bars indicate comparison to Ad5, within same CD treatment group. HVR, hypervariable region.

