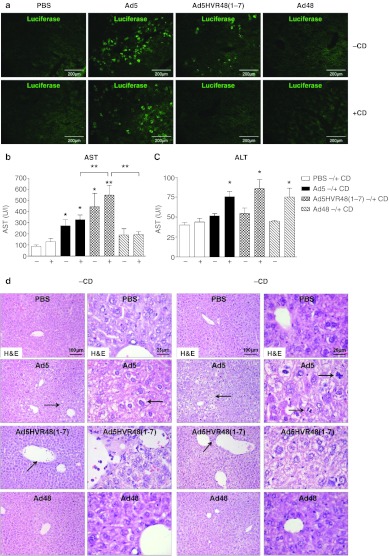
Figure 5.
Quantification of liver gene transfer and hepatotoxicity (48 hours). (a) Luciferase expression in frozen liver sections (4 µm) was detected by immunofluorescence. (b) Serum transaminases, aspartate aminotransferase (AST) and (c) alanine aminotransferase (ALT) were quantified 48 hours postinjection of 1 × 10¹¹ virus particles (vp). (d) Paraffin-embedded liver sections (5 µm) were stained with hematoxylin and eosin (H&E) and assessed by a pathologist. Images were captured using a ×10 and a ×40 objective. Data represent the mean ± SEM (n = 5–8 per group), **P < 0.01, *P < 0.05. Significance indicators directly above histogram bars indicate comparison to phosphate-buffered saline (PBS) control.

