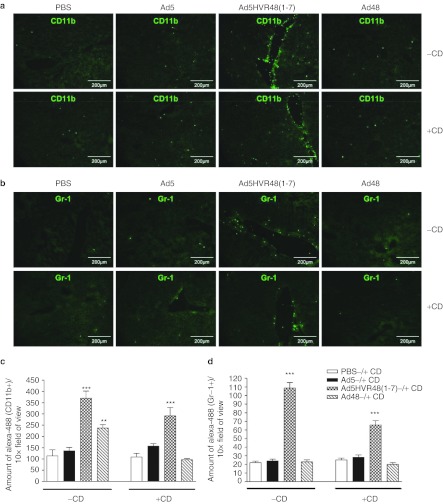
Figure 6.
Phenotypic identification of accumulating cells in periportal areas. (a) Frozen liver sections were stained by immunofluorescence using antibodies to broad myeloid marker CD11b or (b) granulocyte marker Gr-1. Images were captured using a ×10 objective. (c) The amounts of CD11b+ or (d) Gr-1+ cells were quantified in multiple images from several different animals using ImageJ software. All thresholding and adjustments were applied equally across compared images. Data represent the mean ± SEM (n = 3–5 animals/group), ***P < 0.001, **P < 0.01. Significance indicators directly above histogram bars indicate comparison to Ad5, within same CD treatment group.

