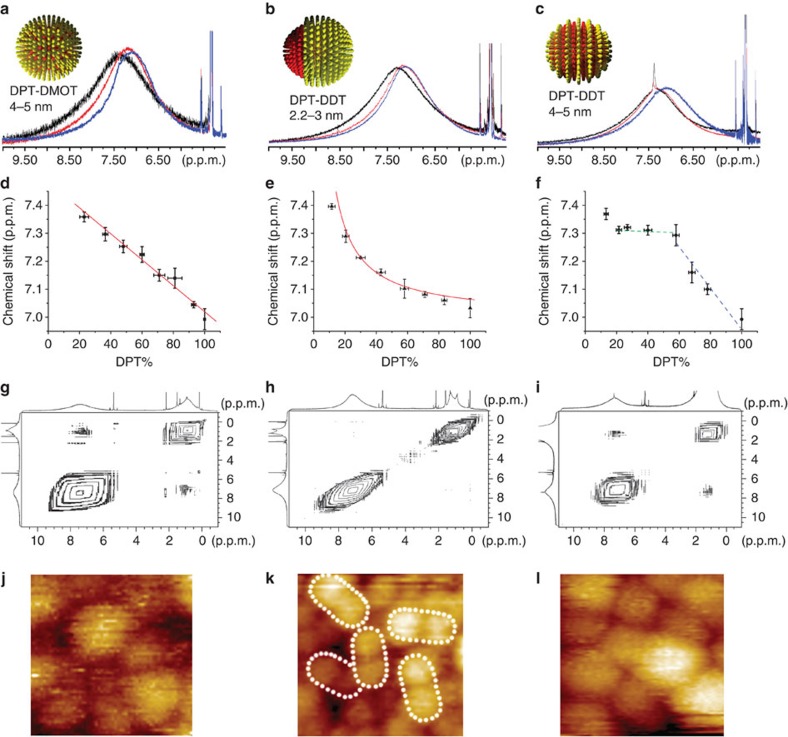
Figure 3. NMR and STM images of nanoparticles.
(a) 1H NMR of randomly mixed nanoparticles Au-DPT0.22DMOT0.78 (black), Au-DPT0.60DMOT0.40 (red) and Au-DPT0.82DMOT0.18 (blue). (b) 1H NMR of Janus nanoparticles Au-DPT0.19DDT0.81 (black), Au-DPT0.56DDT0.44 (red) and Au-DPT0.82DDT0.18 (blue). (c) 1H NMR of striped nanoparticles Au-DPT0.21DDT0.79 (black), Au-DPT0.58DDT0.42 (red) and Au-DPT0.78DDT0.22 (blue). (d–f) Chemical shift of 1H NMR as a function of alkanethiol percentage for randomly mixed, Janus and striped nanoparticles, respectively. Solid red lines in (d) and (e) are the fit to the data (see text). Error bars represent the s.d. of the mean of the chemical shift and of the DPT percentage calculated after cyanide decomposition. (g–i–) NOESY spectra of randomly mixed nanoparticle Au-DPT0.40DMOT0.60, Janus nanoparticle Au-DPT0.56DDT0.44 and striped nanoparticle Au-DPT0.58DDT0.42, respectively. (j–l) STM image of randomly mixed nanoparticle Au-DPT0.40DMOT0.60, Janus nanoparticle Au-DPT0.56DDT0.44 and striped nanoparticle Au-DPT0.58DDT0.42, respectively. (j) and (l) are (17×17 nm) while (k) is (20x20 nm). White dotted ovals delimit each single Janus nanoparticle. Larger STM images can be found in Supplementary Material, Supplementary Figs S2 and 3.

