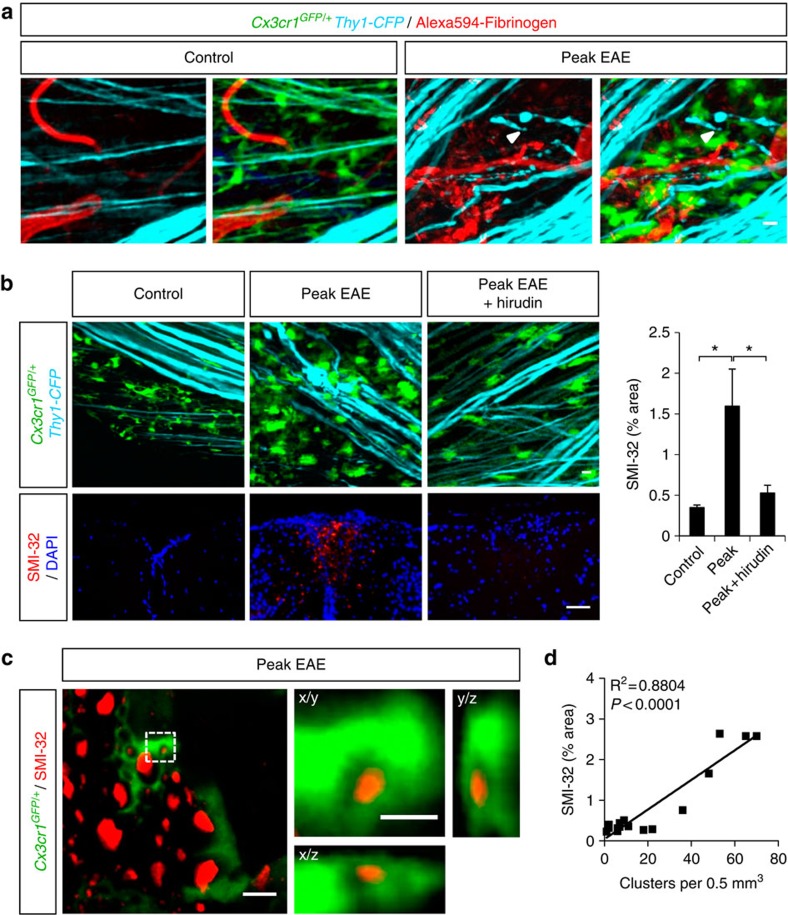
Figure 6. Fibrinogen is required for development of axonal damage in neuroinflammation.
(a) Simultaneous in vivo imaging of GFP-expressing microglia (green), CFP-expressing axons (cyan) and Alexa594-fibrinogen-injected blood vessels (red) in the EAE spinal cord. Axonal damage in the form of blebbing, bending, constrictions and fragmentation (arrowheads) is evident mostly near perivascular microglial clusters, in areas with fibrin deposits. Scale bar, 10 μm. (b) In vivo imaging shows reduced microglial clustering and axonal deformities after anticoagulant treatment. In healthy control (n=5), microglia show even distribution between structurally intact axons. At the peak of EAE (n=9), there are extensive signs of axonal structural abnormalities within areas of microglial clusters. At the peak of EAE, the anticoagulant hirudin (n=12) significantly reduces microglial clustering and morphologic signs of axonal damage. See corresponding Supplementary Movies 8 and 9. Correlated histology using SMI-32, a marker of axonal damage, performed in the same spinal cord area imaged in vivo, shows a decrease of SMI-32-labelled axons in the hirudin-treated mice (n=11), compared with untreated mice at the peak of EAE (n=8). Values are mean±s.e.m. *P<0.05 (one-way analysis of variance (ANOVA)). Scale bars, top: 10 μm; bottom: 50 μm. (c) High resolution confocal microscopy of SMI-32 stained spinal cord sections shows engulfment of axonal fragments (red) by microglia (green). Boxed area is shown in x/y, x/z and y/z projections to confirm the intracellular localization of an axonal fragment within a microglial cell body. Scale bars, left: 10 μm; right: 2 μm. (d) Correlation analysis of the number of clusters with axonal damage (n=16, R2=0.8804, P<0.0001, F-test).

