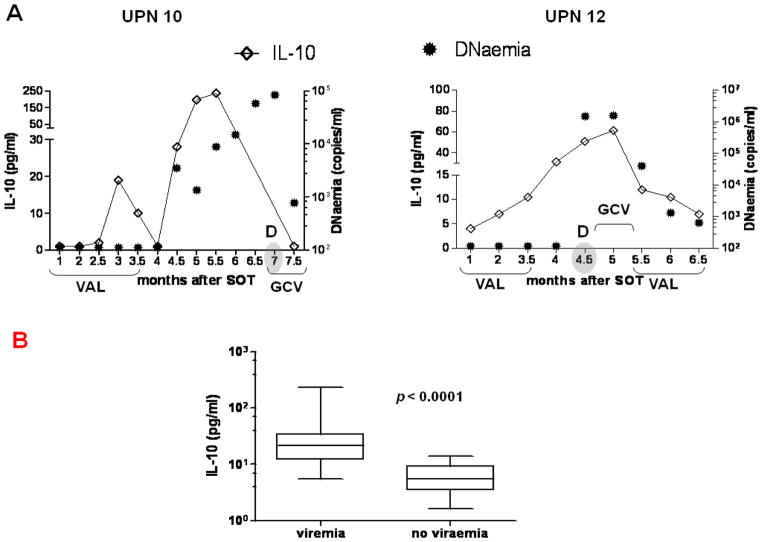
Figure 2. Plasma IL-10 levels.
(A) Longitudinal measurements, at the time points after SOT (months) showed on the x axes, of plasma IL-10 (line intersecting rhomboid symbols, y axes) and CMV viraemia, expressed as copies/ml of CMV DNAemia (circular filled symbols, z axes). Representative UPN 10 (left plot) and 12 (right plot), who developed CMV disease (as “D” on the plots; month of CMV disease diagnosis is shaded) are shown. The length of VALGAN (VAL) prophylaxis and GCV/VAL treatments are indicated on the x axes, for each UPN. (B) Vertical box plots show median, 25th and 75th percentiles of IL-10 measured at viremic or aviremic time points in the D+R− patients. The p values indicate the significance of the difference between the two groups, calculated using GEE models.

