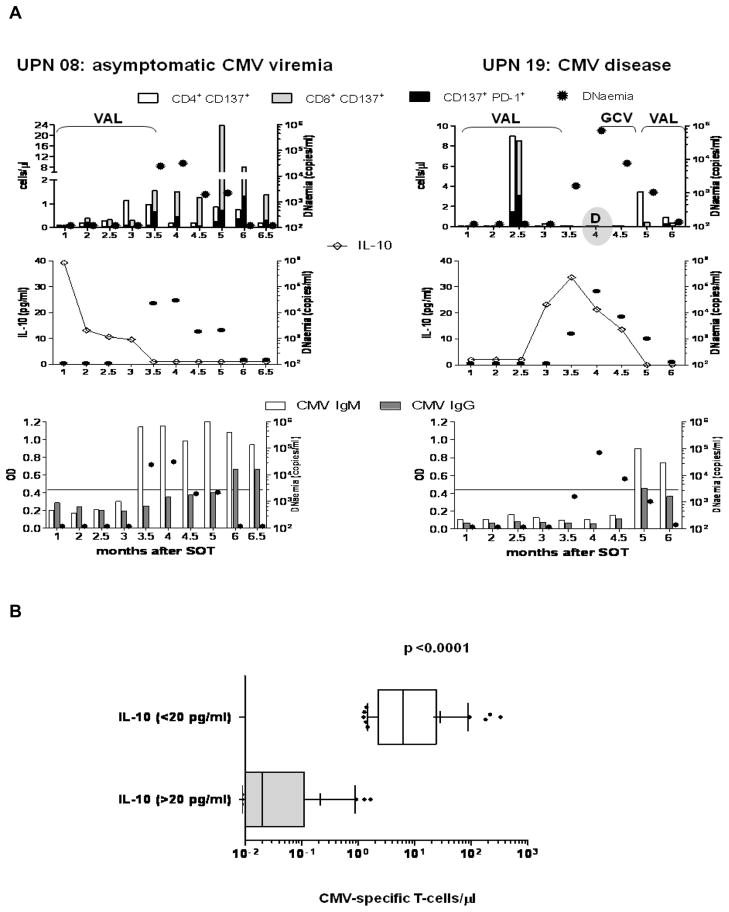
Figure 3. CMV-specific immune responses and IL-10 levels.
(A) Temporal profiles of CMV-specific T-cells (upper panel), antibodies (lower panel) and IL-10 (middle panel) for representative CMV asymptomatic UPN 08 (left plots) and CMV disease UPN 19 (right plots). CMV viraemia, expressed as copies/ml of CMV DNAemia (circular filled symbols, z axes) is shown in each plot. In the upper plots, CD137 and PD-1 surface expression on T-cells stimulated either with pp65 library (UPN 08) or IE-1 library (UPN 19) is shown, as detailed in Figure 1. In the middle plots IL-10 levels are represented as explained in Figure 2A. In the lower plots detection of CMV-specific IgM (white bars) and IgG (grey bars) is reported. The quantitative ELISA results are expressed as optical density (OD, y axes) measured at 450 nm. The line in the plots indicates the threshold of positivity for the tests. (B) The whisker plots show average (+) and 10–90 percentiles of CMV-specific T-cell levels at time points in which corresponding IL-10 measurements were either > (grey box) or < (white box) 20 pg/ml in the entire D+R− patient population. Step-function GEE models were used to calculate the p value.

