
Figure 2.
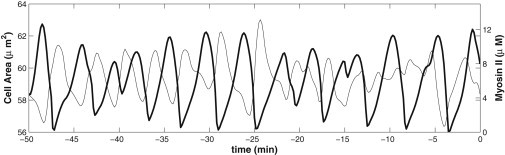
Early phase: fluctuation of the cell area (thin line) and myosin level (thick line) in cell 3 of Fig. 1. Time t = 0 is set to be the onset of net AS contraction, i.e., the end of the early phase and start of the slow phase.
Official websites use .gov
A
.gov website belongs to an official
government organization in the United States.
Secure .gov websites use HTTPS
A lock (
) or https:// means you've safely
connected to the .gov website. Share sensitive
information only on official, secure websites.
Early phase: fluctuation of the cell area (thin line) and myosin level (thick line) in cell 3 of Fig. 1. Time t = 0 is set to be the onset of net AS contraction, i.e., the end of the early phase and start of the slow phase.