
Figure 5.
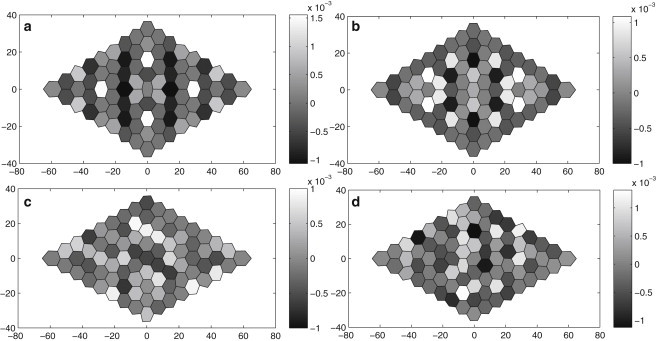
Rate of area contraction (negative) and expansion (positive) for each cell in the AS tissue. The rate is normalized by the cell area and has unit of s−1, with the grayscale assigned according to the scale bars to the right of each plot. (Top panel) The two snapshots are at (a) t = −39.2 min and (b) −25.2 min. The apparent symmetry in the patterns is due to the initially uniform s and m distributions. (Bottom panel) Asymmetric patterns predicted from nonuniform initial conditions. The two snapshots are at (c) t = −40.5 min and (d) −22.5 min.