
Figure 5.
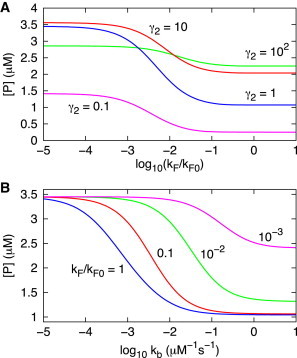
Effect of negative feedback. (A) Protein (P in Fig. 1) concentration at different values as a function of the logarithm of , the production rate constant of enzyme E that produces the metabolite M, relative to s−1. The parameters are given in Table 1 and Table 2 except . (B) The extent of regulation expressed in terms of protein level as a function of the logarithm of association rate constant kb for metabolite binding. The parameters are listed in Table 1 and Table 2 except and . is fixed at 10 nM.