
Figure 7.
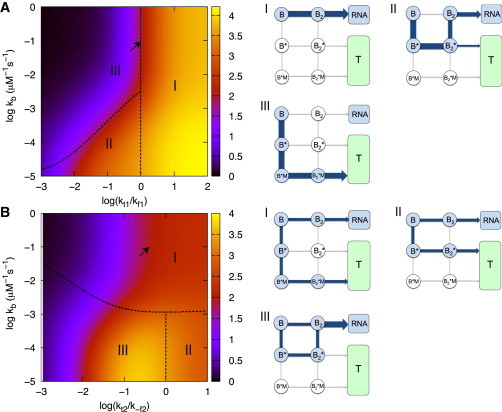
Dependence of protein production on the network parameters with feedback. (A) Protein levels as functions of and with negative feedback using parameters in Table 1 and Table 2. The scale for the production is shown in the color spectrum. The dependence of on and is categorized into three regimes (see text for details). Points on the dashed line separating regime II and regime III satisfy . The major pathway in the transcription process in each regime is shown on the right. The arrow indicates the data point resulting from using the value of and in Table 1. (B) Expression level of proteins as functions of and with negative feedback using the parameters in Table 1 and Table 2. The dependence of on and is categorized into three regimes. Points on the dashed line separating regime I and regime II/III satisfy . The corresponding major transcription pathways are shown on the right. The data point corresponding to the arrow results from using the value of and in Table 1.