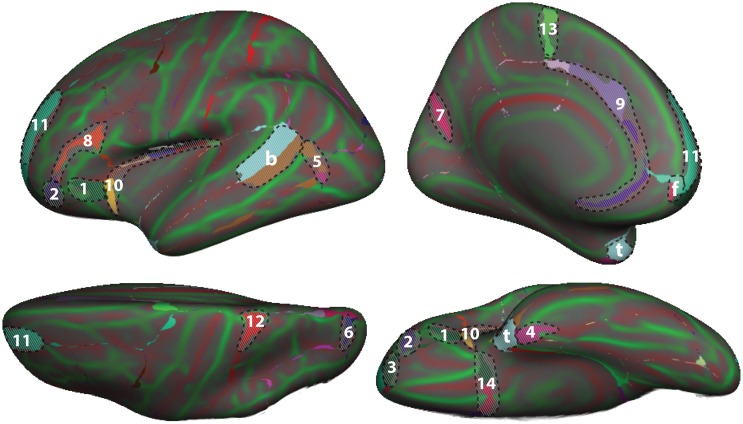
Figure 4.
Comparison of DK and DKT40 classifier atlases. A comparison of the automatic labeling of the FreeSurfer “fsaverage” cortical surface by the DK and DKT40 atlases. Lateral (upper left), medial (upper right), ventral (lower right), and dorsal (lower left) views of the left hemisphere surface are shown. Regions in color overlaid atop the red-green surface (as in Figure 2) indicate areas that were labeled differently by the classifiers; where there are mismatches, the DKT40 labels are shown (with the same colors as in Figure 1). Areas denoted by letters mark the approximate location of regions in the DK protocol that were removed in the DKT protocol, including the banks of the superior temporal sulcus (b), frontal pole (f), and temporal pole (t). Additional, relatively large mismatched areas are denoted by numbers. Sources of mismatch between the protocols include: i, differences in region boundaries, particularly for the medial (1) and anterior (2) borders of pars orbitalis, the anterior border of the lateral orbitofrontal region (3), the lateral border of entorhinal cortex (4), and the anterior boundary of lateral orbital gyrus (5), and the posterior boundary of the superior parietal region (6); ii, variability of the bounding landmarks, particularly for the fundus of the parietooccipital sulcus (7) and the inferior frontal sulcus (8); iii, variation in the interpretation of landmarks, particularly for the cingulate sulcus (9), dorso-rostral portion of the circular sulcus (10), the rostral portion of superior frontal sulcus (11), the dorsal portion of the postcentral sulcus (12), the paracentral sulcus (13), and the posterior boundary of the medial and lateral orbitofrontal regions (14), and iv, variation in the training data set that was used to construct the classifier. The medial surface view was rotated from the parasagittal plane to expose the temporal pole.

