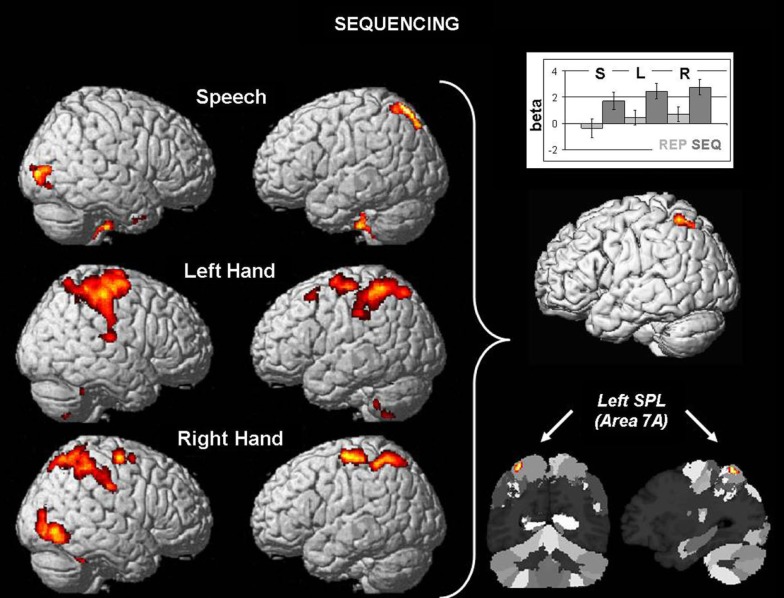
Figure 1.
Left: surface rendering of differential brain activation in the sequencing condition (A-B-A) as compared to repetition (A-A-A) as a function of effector (speech, left hand, right hand). All results are displayed at an FWE-corrected threshold of p < 0.05, effected as uncorrected maps at p < 0.001 with a cluster size of k ≥ 250 voxels. Right: Conjunction of the three sequencing effects yields one common region in the left superior parietal lobule in area 7A. Sections illustrate the position of the activation relative to the cytoarchitectonic maximum probability map (Scheperjans et al., 2008). The bar graphs shows the consistency of higher activation in the sequencing conditions (dark gray) as compared to repetition (light gray) in speech (S), left hand movements (L), and right hand movements (R).

