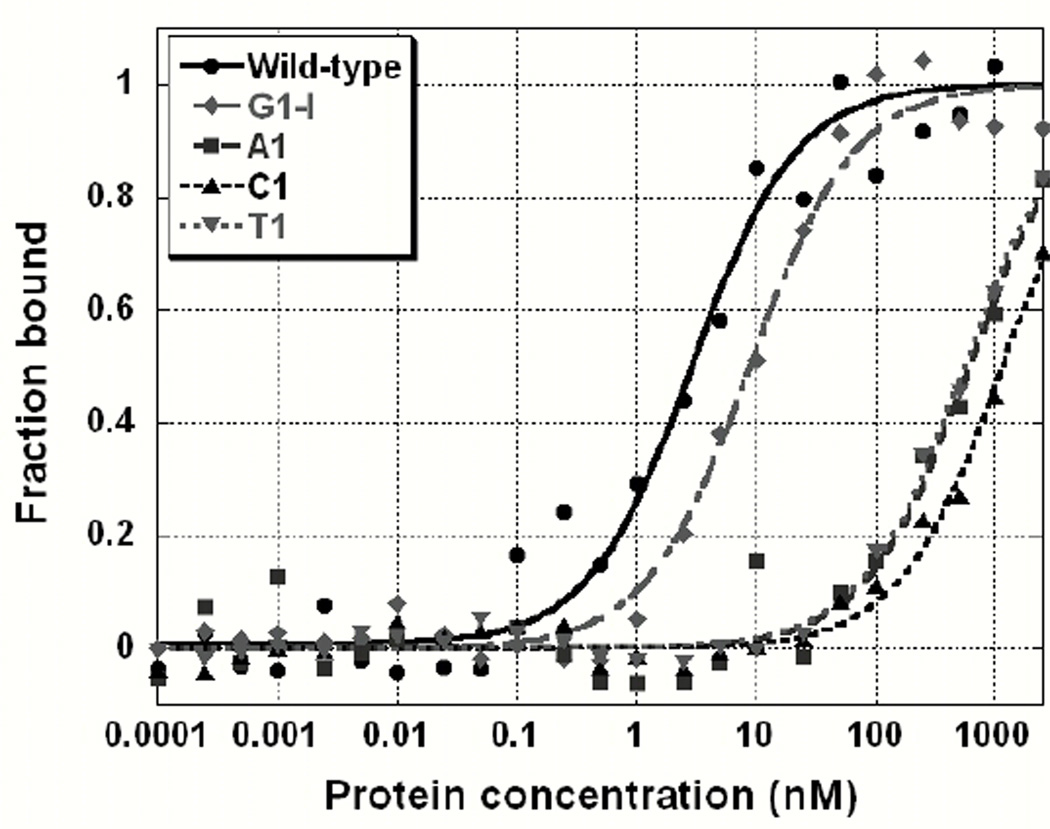
Figure 3.
Binding curves for site-specific substitutions at G1. Replacement of G1 with other natural bases has a large effect on binding affinity, while inosine has a modest effect. Data are fit to a two-state model as described in Materials and Methods. Wild-type data is shown in circles, inosine with diamonds, A, C and T are shown in squares, traditional triangles, and upside down triangles, respectively.

