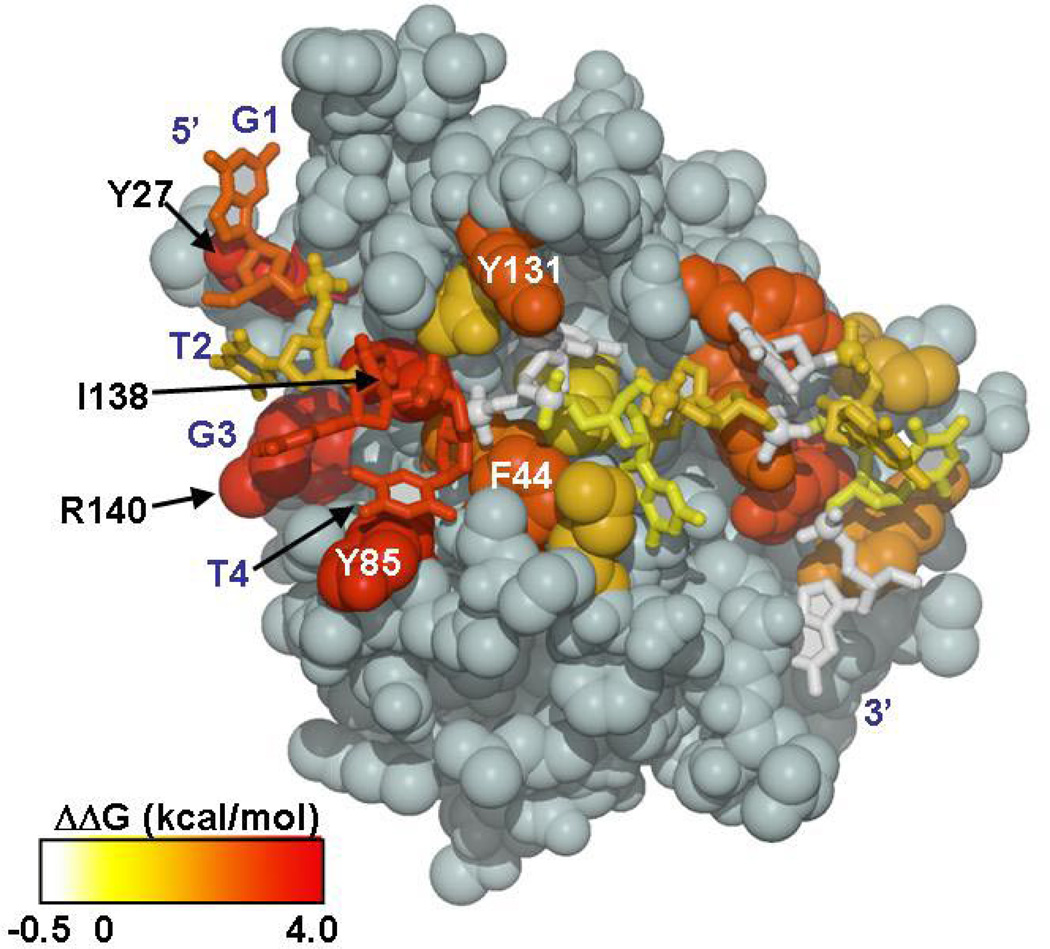
Figure 5.
The energetic contributions of each DNA base and individual protein residues on binding mapped onto Cdc13-DBD/Tel-11 structure. The magnitude of the change in binding free energy is illustrated using color ramp from white to red, for −0.5 – 4.0 kcal/mol. Values for ΔΔG are from the ensemble average values obtained in the degenerate library experiment and from the alanine mutagenesis study by Anderson et al. 2003 (48). Figure prepared using MOLSCRIPT (63).

