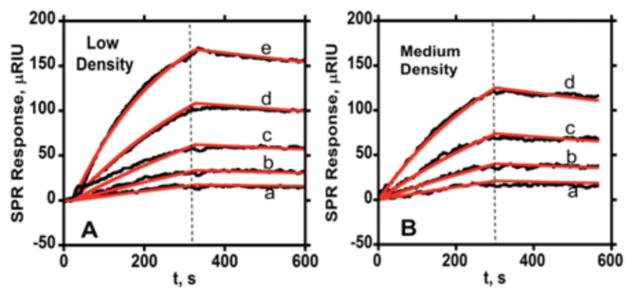
Figure 1.
Association (0–300 s) and dissociation (300 s–600 s) data for free anti-PSA at two different PSA surface coverages in PBS-T at 50 μL min−1 (—experimental data, — simulated fit) showing SPR response for series of antibody concentrations (a- 3.12 nM, b- 6.25 nM, c- 12.5 nM, d- 25 nM, e- 50 nM): (A) with immobilized PSA surface density 2.7 × 10⁹ molecules mm−2 (low) (B) SPR response for same Ab2 concentrations with PSA surface density of 9.0 × 10⁹ molecules mm−2 (medium) (In all SPR curves, vertical dashed lines represent switch from association to dissociation kinetics).

