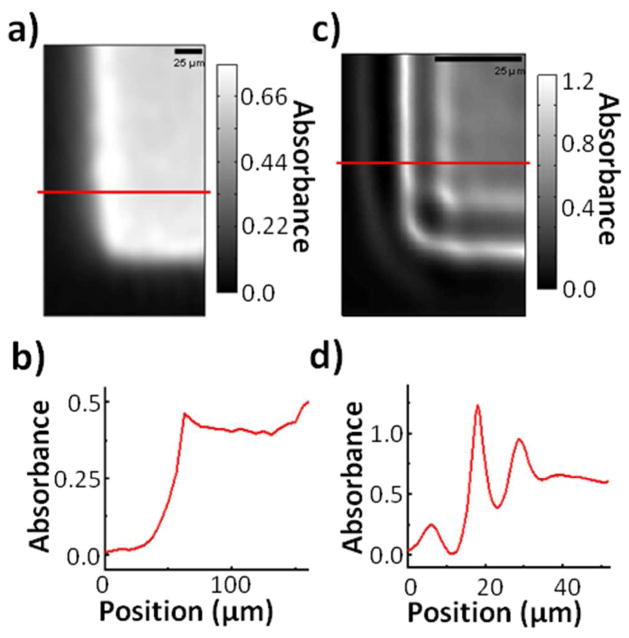
Figure 6.
A) Image of a USAF 1951 bar target corner with a commercial FT-IR instrument. The increased ‘absorbance’ at the sharp feature edges is actually due to increased scattering. B) Graphical profile of one row of pixels from 6a. Aside from some blurring, there does not appear to be well-defined interference pattern at the feature edges due to scattering. C) Image of the corner with the point-mapping instrument and a 0.72 μm aperture. The edge structure looks starkly different from that of 6a. D) Graphical profile of one row of pixels from 6c. Each edge shows a series of minima and maxima that were not discernible with a commercial FT-IR instrument.

