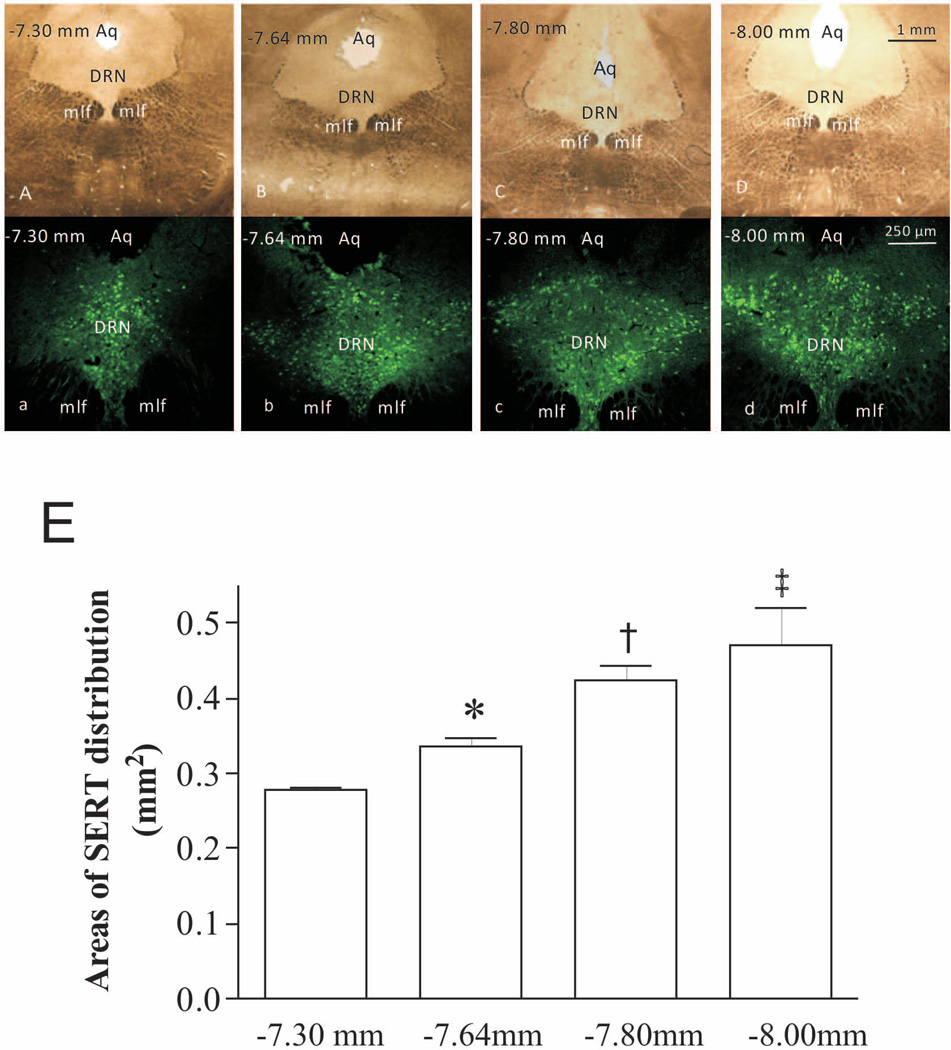
Figure 2.
SERT distribution in rat DRN. SERT is expressed throughout the DRN, but distributed differently in sections. (A–D): Coronal sections of the DRN were obtained from bregma −7.30 mm, −7.64 mm, −7.80 mm and −8.00 mm respectively. Microphotos were captured in bright field. (a–d): SERT immunostaining in these sections. Images were obtained by a fluorescence microscope. Aq: aqueduct; mlf: medial longitudinal fasciculus. (E): Areas of SERT distribution in immunostaining microphotos were measured by Image J software and subjected to statistical analysis. *p<0.05, compared to the bregma −7.30 mm group; † p<0.05, compared to the bregma −7.64 mm group; ‡ p<0.05, compared to the bregma −7.80 mm group (n=4/group).

