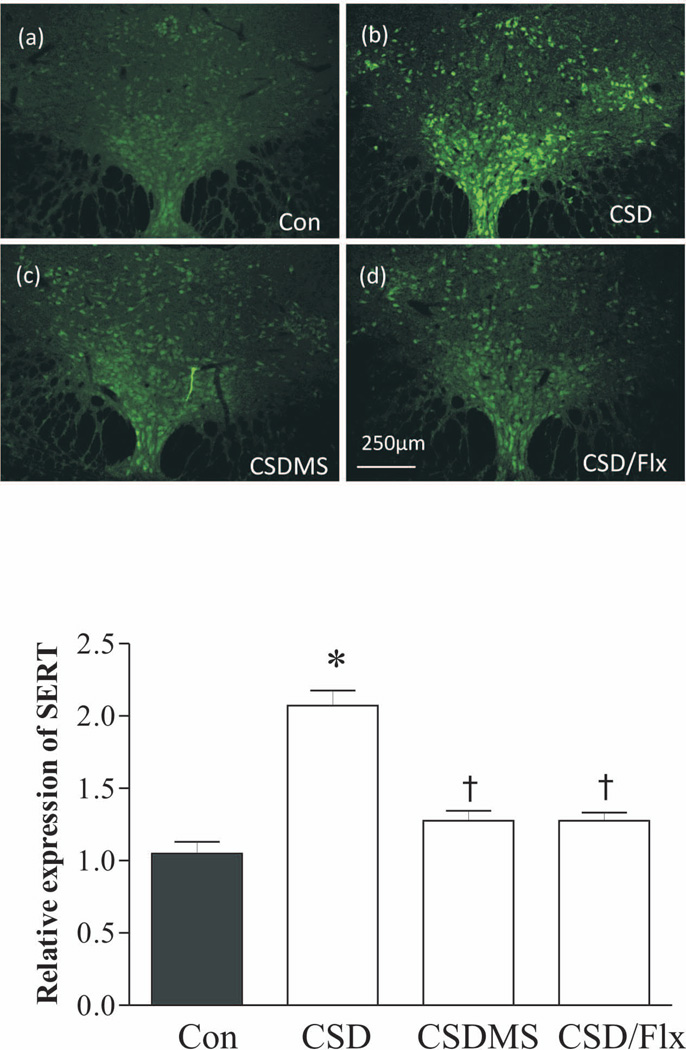
Figure 4.
Effects of CSD on the immunofluorescence staining of SERT. Upper panel: SERT immunoreactivities in rat DRN were detected by a confocal microscope. Coronal DRN sections were taken at −7.80mm from bregma. Lower panel: quantitative analyses of the immunofluorescence by the Image J software. *p<0.05, compared to the control group; † p<0.05, compared to the CSD group (n=4/group). See Fig. 3 legend for abbreviations.

