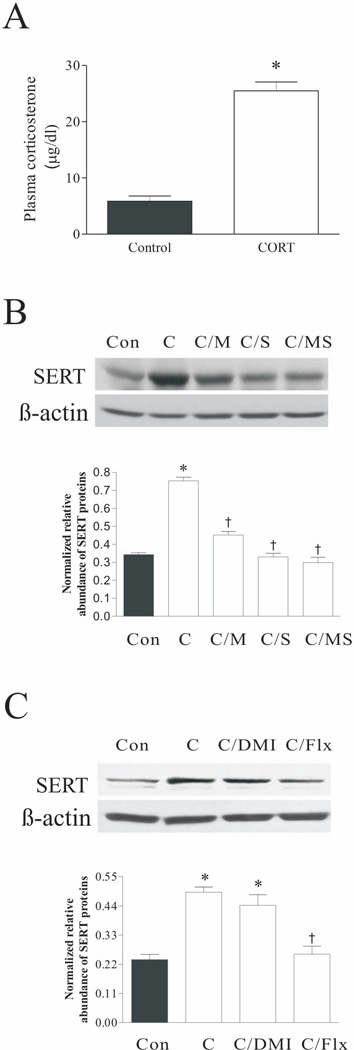
Figure 7.
Effect of CORT treatment on plasma CORT concentrations (A), and SERT protein levels in rat DRN after CORT treatment plus corticosteroid receptor antagonists (B) or antidepressants (C). The upper panels in B and C were obtained by western blotting for SERT. The lower panels in B and C showed quantitative analysis of band densities. Values of SERT bands were normalized to those of β-actin probed on the same blot. *p<0.05, compared to the control group; † p<0.05, compared to the CORT group (n=4/group). Con: control; C: corticosterone; C/DMI: CORT plus treatment with desipramine; C/Flx: CORT plus treatment with fluoxetine; C/M: CORT plus treatment with mifepristone; C/S: CORT plus treatment with spironolactone; C/MS: CORT plus treatment with both mifepristone and spironolactone.

