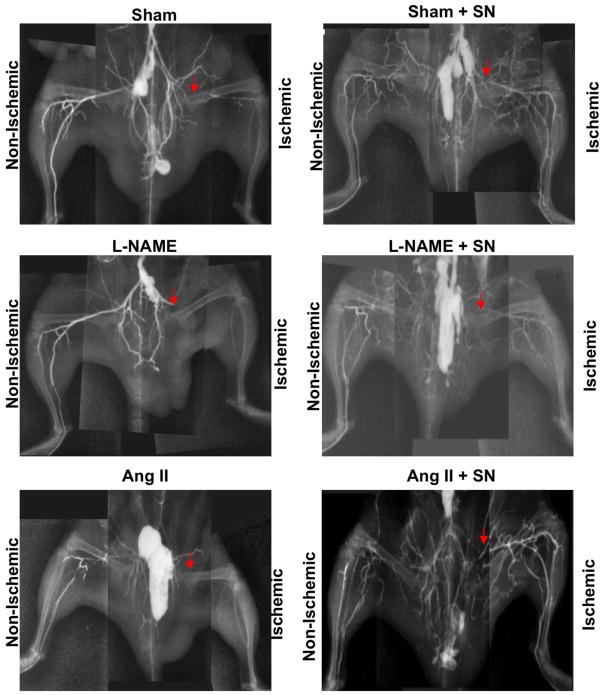
Figure 3.
Microangiography determined at the end of the treatment period in all groups (sham ± SN, Ang II ± SN and L-NAME ± SN). Contrast media (barium sulfate, 1 g/ml) was injected into the abdominal aorta, and then angiogram from of the right and left hind-limb was assessed with digital X-ray transducer acquired images. Images were then assembled to obtain a complete view of the hind-limb vasculature; image is representative of n=5.

