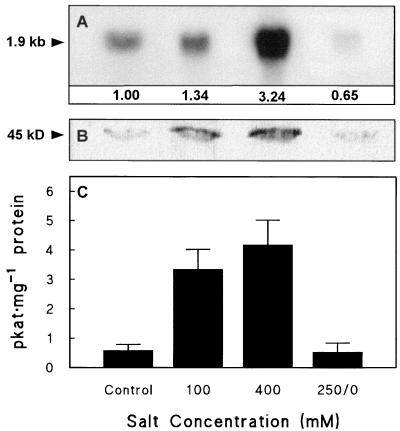
Figure 3.
CMO expression in sugar beet leaves after long-term salinization. Plants were salinized gradually and then maintained at the salinity levels shown for at least 3 d. One batch of plants (250/0) was salinized to an intermediate salt level (250 mm), then transferred to nutrient solution for 3 d before harvest; a prior experiment had demonstrated that CMO induction at 250 mm salt was the same as at 400 mm. Controls received nutrient solution alone. A, Northern analysis; numbers below the lanes show the CMO mRNA abundance relative to the unsalinized control (1.0), normalized for RNA loading. B, Western analysis; lanes contained 50 μg of protein. C, CMO activity (means and se for three replicates). Other experimental conditions were as in Figure 2. The experiment was repeated with similar results.

