
Figure 2.
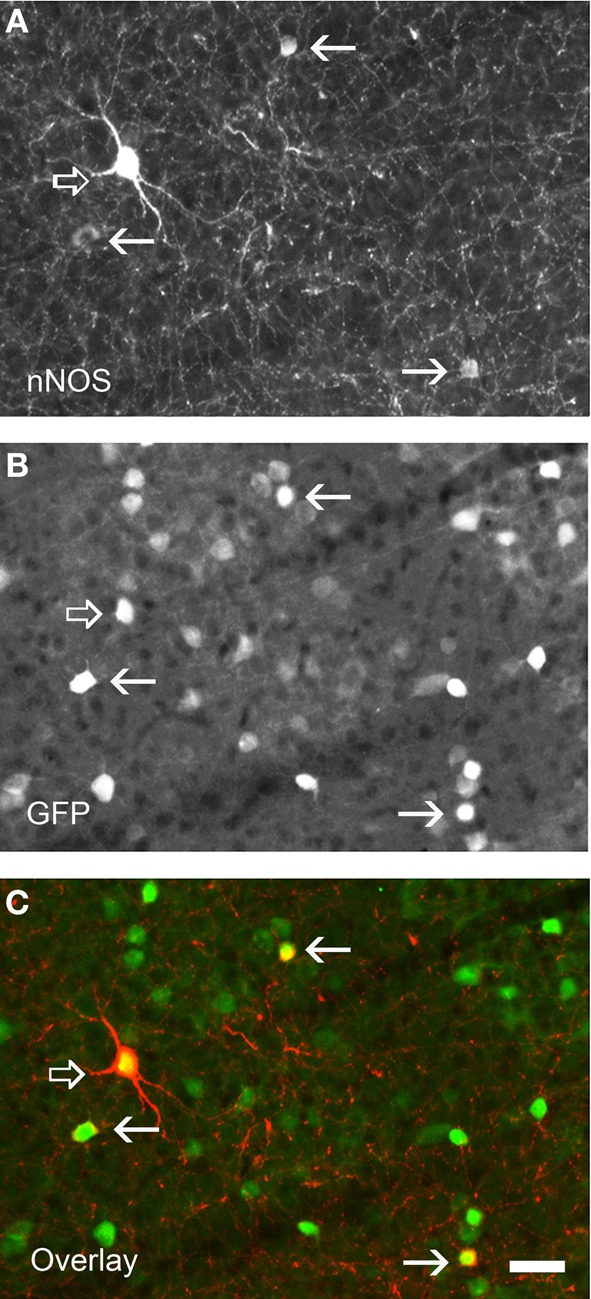
Immunolabeling for nNOS in a neocortical sections of GAD67:GFP mouse strain showing the two nNOS populations. (A) Fluorescence picture showing immunohistochemical expression of nNOS. (B) Expression pattern of GFP. (C) Overlay of (A) and (B). nNOS-type I neurons display strong immunolabeling (open arrows) and a large soma whereas nNOS-type II (arrows) are weakly stained and display smaller soma. Note that all nNOS-positive neurons are GABAergic. Scale bar: 30 μm. Unpublished caption obtained from preparations used for the study presented by Perrenoud et al. (2012a).