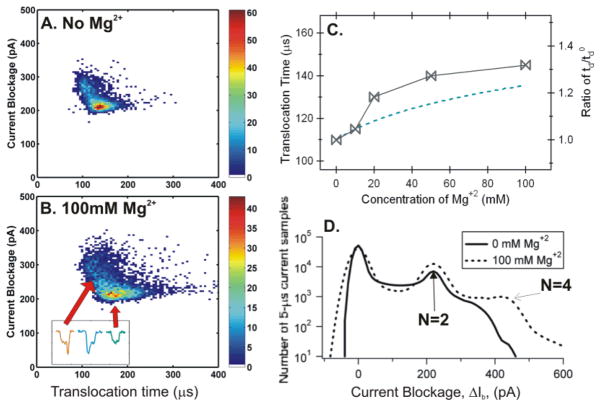
Figure 5.
Event number density plots for (A) 0 mM and (B) 100 mM Mg+2 in TE buffer with 20% glycerol. The insert in Fig. 5B shows three events, one corresponding to a circular DNA and the other two corresponded to branched or bent supercoiled DNA. (C) Left, td as a function of the amount of Mg+2 ions added. Right, the change in . The Dashed line is the theoretically predicted values from MCC theory (see SI.4.). (D) Histograms of the number of 5-μs current blockage samples per 2 pA bin for 0 and 100 mM Mg+2. A ~14 nm pore was used with I0 = 11.25 nA.

