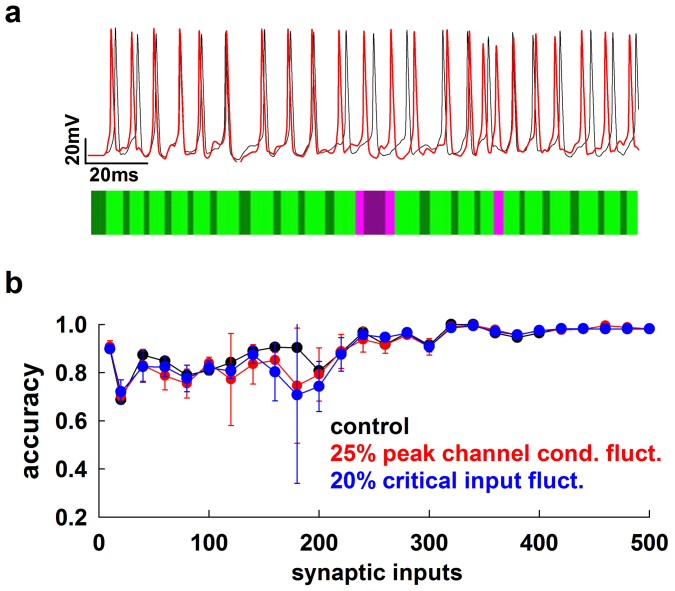
Figure 2. The method is accurate and robust to fluctuations of model parameters.
(a) Schematic representation of accuracy calculation in a typical case (cell cd1152); somatic traces obtained from simulations of the full (black) and reduced (red) model were scanned to test for mismatch of spikes or silent periods occurring within a variable time window (see Methods); light green: True Positive; dark green: True Negative; light pink: False Positive; dark pink: False Negative; Accuracy = 0.9; (b) accuracy of the reduced model for cell c70863 as a function of the number of active synaptic inputs using the original set of the full model parameters (black), and average accuracy (n = 10) for ±25% or ±20% random fluctuations in peak channels conductance (red) or in the critical input max Stim (blue), respectively.

