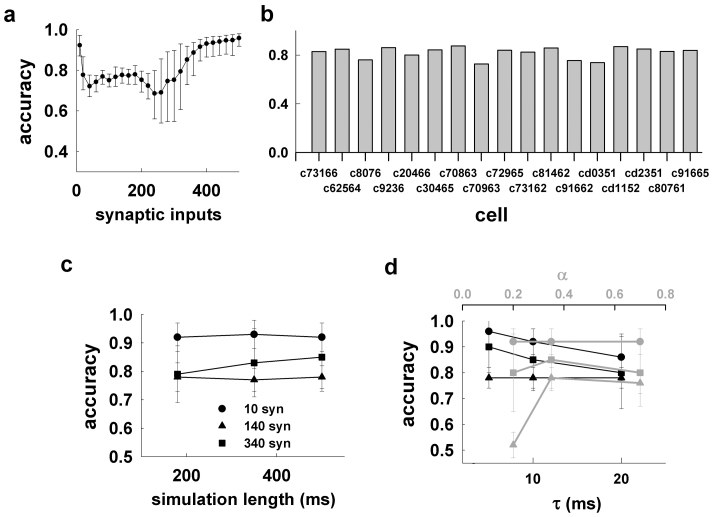
Figure 3. The method is accurate for different morphologies.
(a) Average accuracy (n = 17, ±sd) obtained for the reduced models of all morphologies as a function of the number of active synaptic inputs; (b) average accuracy for the reduced model of each morphology, from 260 simulations using a different number of synaptic inputs with random spatial redistribution, activation times, and peak conductance; (c) average accuracy for 10, 140, and 340 synaptic inputs as a function of the simulation length; in all cases, α = 0.35 and τ = 10 ms; (d) average accuracy (n = 170) obtained for the reduced models of all morphologies from 500 ms long simulations with 10, 140, and 340 synaptic inputs as a function of τ (black plots, α = 0.35), and as a function of α (gray plots, τ = 10 ms).

