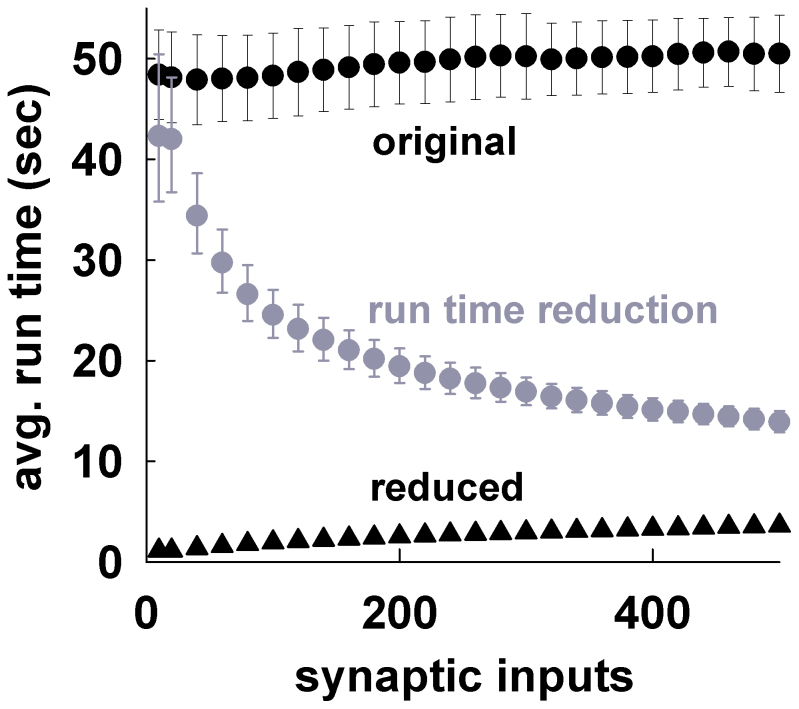
Figure 4. The method greatly reduces the run time.
(black) Average runtime for a 500 ms simulation, as a function of the number of active synaptic inputs (α = 0.35, τ = 10 ms), for the original models (circles) and their reduced version (triangles). (gray) Average run time reduction (error bars represent 95% confidence interval).

