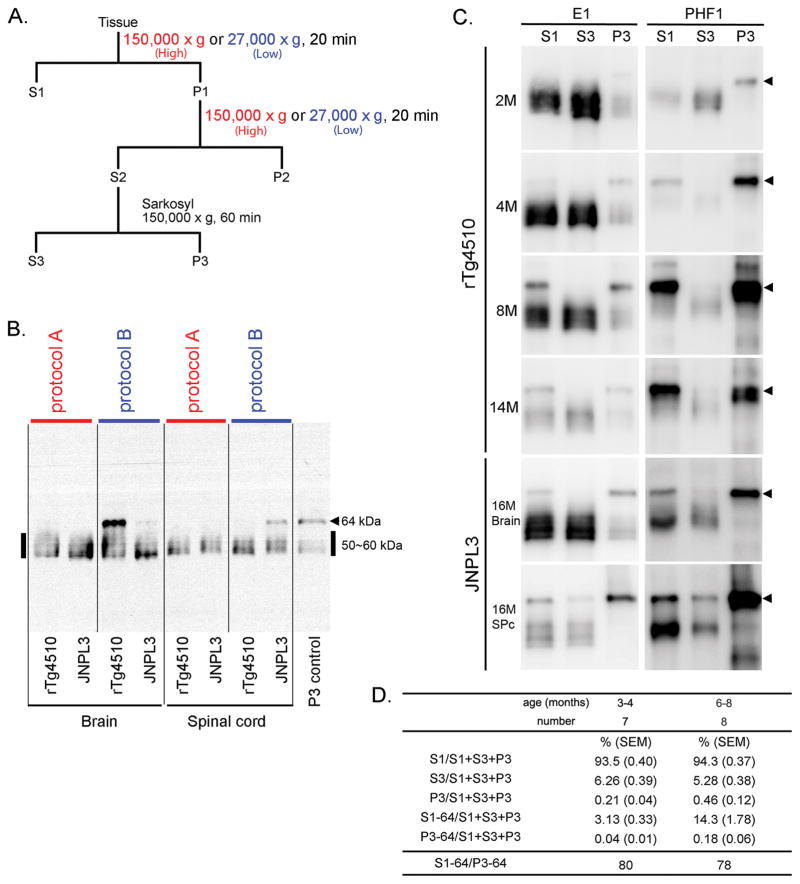
Fig. 1. Sarkosyl-insoluble tau preparations from the brains of rTg4510 and JNPL3 mice: models of tauopathy.
A. Comparison of two protocols for preparing sarkosyl-insoluble tau. Brain homogenates were separated into TBS-extractable (S1), high-salt and sarkosyl-extractable (S3), and sarkosyl-insoluble (P3) fractions. S1 fraction was separated by centrifugation at either at 27,000 × g (protocol A) or at 150,000 × g (protocol B) for 20 min at 4°C. Pellets were re-homogenized in 5 volumes of high salt/sucrose buffer and centrifuged as above. The supernatants were collected and incubated with sarkosyl for one hour at 37°C, followed by centrifugation at 150,000 × g for one hour at 4°C to obtain salt and sarkosyl-extractable fractions (S3 fraction) and sarkosyl-insoluble pellets. B. Western blots of brain and spinal cord samples from rTg4510 and JNPL3 mice. S1 fractions from rTg4510 (13 month-old, female) and JNPL3 (16 month-old, female) mice were derived from 0.01 mg and 0.02 mg of tissue, respectively. With the two different protocols, Western blots probed with E1 antibody displayed different tau profiles. The arrow head indicates 64 kDa tau and bold line indicates 50–60 kDa tau. C. Western blots of brain samples from rTg4510 and JNPL3 mice. S1, S3, and P3 fractions were loaded at a ratio of 1:16:50 (based on tissue weight). S1 fractions from rTg4510 and JNPL3 mice were derived from 0.01 mg and 0.02 mg of tissue, respectively. Arrowheads indicated 64 kDa tau. D. The proportion of P301L hTau in different fractions. Two age groups were analyzed from Western blots using the E1 antibody. Ratios of 64 kDa tau in the S1 fraction versus 64 kDa tau in the P3 fraction are shown at the bottom of the figure.

