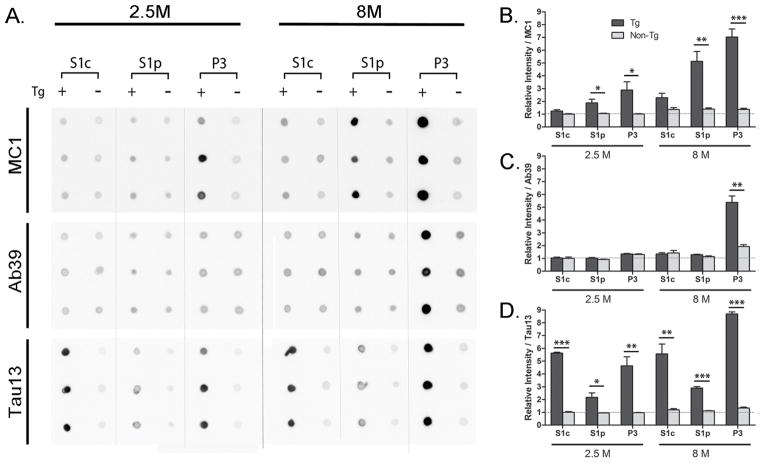
Fig. 5. Dot blot analysis of brain extracts from rTg4510 mice.
A. Fractions of S1c (150,000 × g supernatant of S1) and S1p (150,000 × g precipitate of S1) and P3 fraction from rTg4510 (Tg +; n=3) and wild type control (Tg −; n=3) brain homogenates were dot blotted. Two age points were evaluated: 2.5 month-old (2.5 M) and 8 month-old (8 M). One μl of each sample was spotted on nitrocellulose membrane and probed with MC1, Ab39 and Tau13 antibodies. B. Quantification of MC1-immunopositive signals in different fraction. C. Quantification of Ab39-immunoreactive signals in different fraction. D. Quantification of Tau13-immunorective signals in different fraction. Relative signal intensities are means ± SEM normalized to the value from 2.5 month-old wild type S1c sample. Significant differences were found between rTg4510 and non-tg samples: *p<0.05; **p<0.01; and ***p<0.001.

