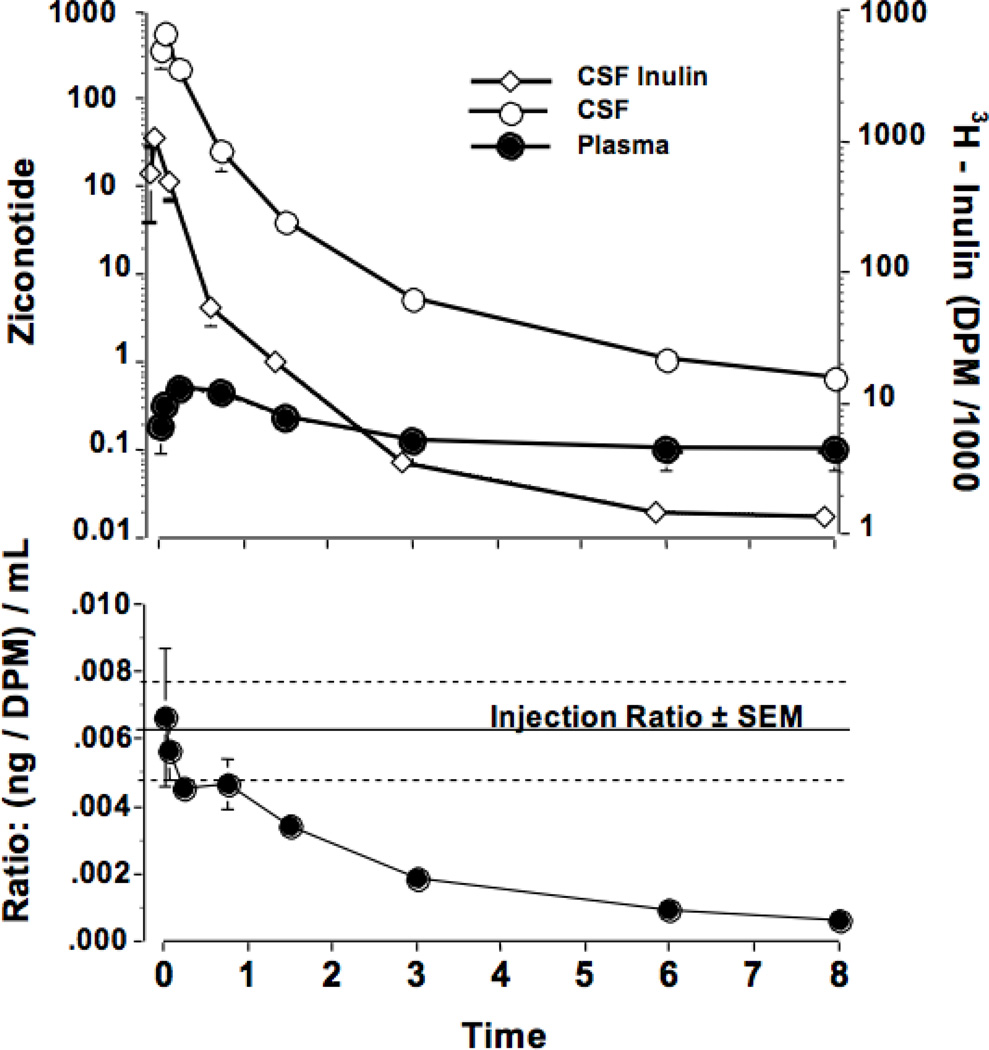
Figure 1.
The concentrations of ziconotide (ng/mL) and inulin (DPM/mL) in the lumbar CSF (top) as a function of time after the bolus intrathecal injection of ziconotide (10µg) and inulin (1µCi) in 1 mL. The bottom panel presents the ratio of ziconotide to inulin as a function of time after intrathecal delivery. Each point represents the mean and SEM of data from 5 dogs. Calculated kinetics are presented in Table 1.

