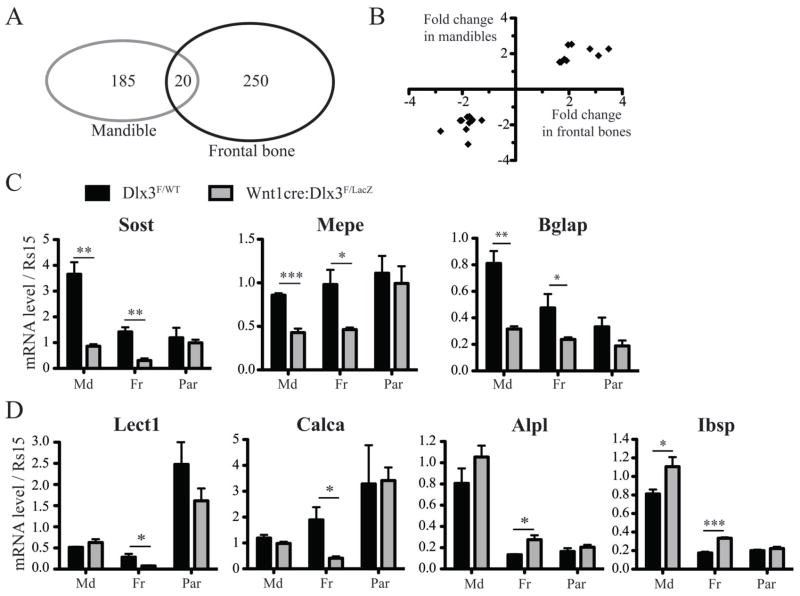
Figure 3. Bone markers affected in frontal bones and/or mandibles in Wnt1-cre:Dlx3F/LacZ mice.
A) Diagram showing the overlap between the genes significantly affected by NC-deletion of Dlx3 in mandibles and in frontal bones at P0. Including Dlx3, 21 genes were found to be affected in both tissues. B) Graph plotting the 20 genes affected in both mandibles and frontal bones, according to their fold change in both tissues. All these genes, listed in table I, exhibit the same trend in both tissues. C) qPCR analysis of the mRNA levels of Sost, Mepe and Bglap in mandibles, frontal bones and parietal bones from WT and cKO mice at P0. T-test, n=4. D) Same as C for Lect1, Calca, Alp and Ibsp.

