Figure 4.
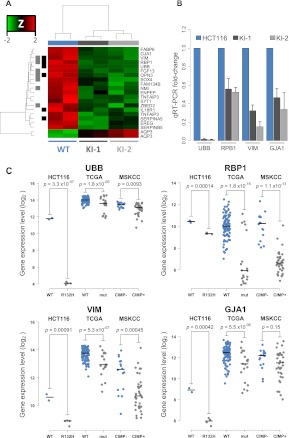
Gene expression profiling of HCT116 IDH1R132H/WT cell lines. HCT116 IDH1R132H/WT knock-in clones and parental cells were analyzed using Affymetrix Human Genome 2.0 Arrays. (A) Hierarchical clustering of probes differentially expressed in HCT116 parent versus knock-in cells. Samples are represented by columns and differential probes by rows. Samples are annotated by IDH1 genotype for wild-type HCT116 (blue) and IDH1R132H/WT knock-in cells (gray). Each probe is normalized (Z-score), and the color of the heat map represents the relative expression of each sample (red: overexpressed; green: underexpressed). Probes are annotated for overlap with genes found differentially expressed in TCGA GBMs (black) (Noushmehr et al. 2010) and LGGs (gray) (Turcan et al. 2012). Clustering is performed using an average clustering algorithm and a Euclidean distance dissimilarity metric of the normalized expression. (B) Quantitative real-time PCR (Q-PCR) validation of candidate genes UBB, RBP1, VIM, and GJA1 for IDH1R132H/WT–mediated transcriptional repression. Gene expression fold-changes were quantified for each candidate gene by using three independent mRNA samples from each clone and calculated relative to parental cell line. Shown is the mean ±SD of the triplicate determinations relative to HCT116 cells. (C) Stripcharts of gene expression values for validated genes in HCT116 parental (WT: blue) and IDH1R132H/WT (R132H: gray) cells as well as the same probes from 117 TCGA primary GBMs that are IDH1 wild-type (WT: blue, n = 98) or mutated (mut: gray, n = 19) and 52 LGGs that have gene expression data and G-CIMP negative (CIMP−: blue; n = 16) or positive (CIMP+: gray; n = 36) classification. (Lines) Median values for each group. P-values were calculated using Welch's two-sided t-test.

