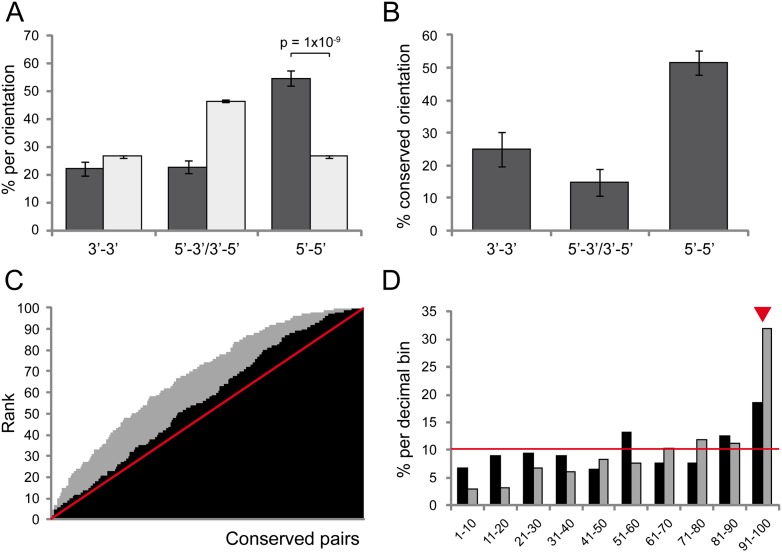
Figure 2.
Predictive features of coregulated gene pairs. (A) Percentage of gene pairs oriented in 3′–3′ (convergently transcribed), 5′–3′ or 3′–5′ (codirectionally transcribed), or 5′–5′ (divergently transcribed) among human conserved gene pairs (dark gray) and control set (all nonconserved, nonparalogous gene pairs; light gray). Conserved pairs are highly enriched in 5′–5′ orientation (P = 1 × 10⁻⁹, χ2 test). (B) Percentage of pairs with fully conserved orientation across species for human conserved gene pairs; 5′–5′ pairs are more conserved. (C) Cumulative plot of ranks of ranked correlation coefficients of conserved pairs among the control data set (nonconserved neighbor pairs with the same orientation and similar intergenic distance; black) and random gene pairs (gray). The red line shows the expected cumulative pattern if coexpression was similar to the controls, and the area above the line the excess of highly coexpressed pairs. (D) Percentage of conserved pairs with ranks in each of the decimal bins. The red line (10%) indicates the expected values. Conserved pairs were significantly enriched in ranks of the last decimal bin (91–100, red arrowhead).

