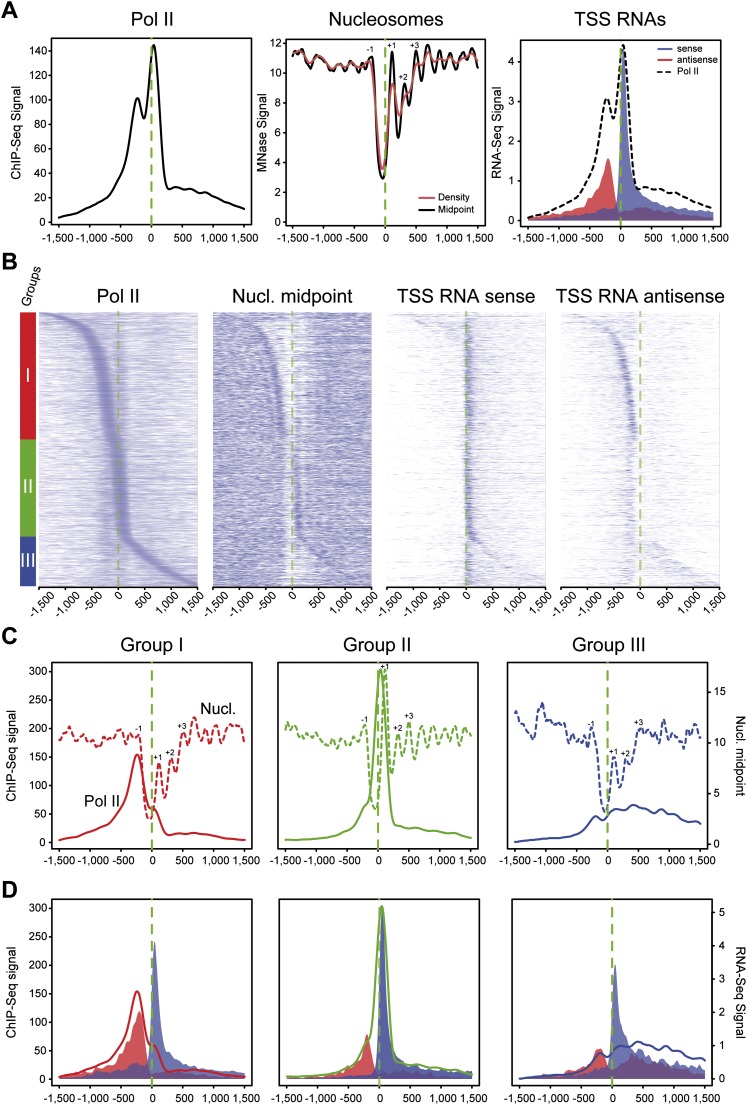
Figure 1.
Three groups of mammalian promoters are defined by Pol II occupancy and correlate with directionality of paused transcripts and nucleosome occupancy. (A) Average profiling of Pol II (left), nucleosomes (middle), and short directional TSS-RNAs (right) based on ChIP-seq, MNase-seq, and strand-specific RNA-seq, respectively. The analysis was performed on 1727 active promoters in mouse primary CD4+ CD8+ (DP) sorted T-cells (top 20% of Pol II signal distribution on selected promoters). The main aNDR is delimited by −1 and +1 nucleosomes around the TSS (dashed green line), approximately between −200 bp and +100 bp around the TSS. Nucleosomal midpoints (middle, black line) show a more marked periodicity than pure nucleosome occupancy (red) and also reveal strong +2, +3 nucleosomes. (B) Heat map of features described in A on promoters sorted by position of the main Pol II accumulation area (peak) from the most 5′ to the most 3′ around TSSs. Three main groups are defined by Pol II occupancy (left panel): class I most 5′ (red bar), class II TSS-proximal (green bar), and class III most 3′ (blue bar). The corresponding heat maps for nucleosome midpoints and short TSSs RNA heat maps are indicated. (C) Pol II (solid line) and nucleosome midpoint profiling (dashed lines) of the three groups defined in B. (D) Profiling of short sense (blue) and antisense (red) TSS-RNAs from the groups defined in B. Pol II corresponding profiles are indicated as in C.

