Figure 3.
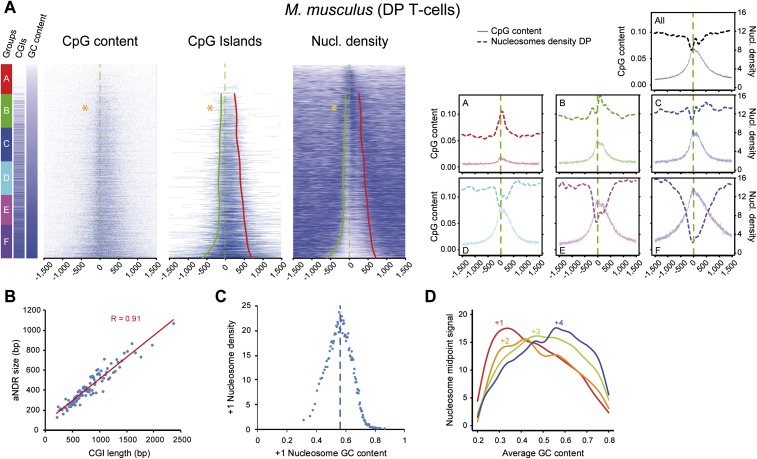
GC content at promoters conditions +1 nucleosome strength and correlates with aNDRs in GC-rich areas. (A) Heat maps of CpG dinucleotides, CpG islands, and nucleosome density, ordered by increasing GC content, in murine DP T-cells at all 8634 promoters (excluding those in close proximity to other annotations) and centered on the TSSs. On the left of the heat maps, the six groups A–F (red to violet boxes) of increasing GC content are represented along with the presence of CGIs in each group (blue bar represent CGIs, and white bars non-CGI promoter). The percentages of CGI promoters in each group from top to bottom are 4%, 34%, 55%, 65%, 78%, and 93%. Therefore, the first two groups can be classified as CGI-poor. The profiles of CpG content and nucleosome densities for all promoters (top) or the six subgroups A–F are shown on the right. The red and green lines on the CGIs and nucleosome density heat maps show the trend lines of the CGIs borders (see Methods) starting from group B because group A does not contain a significant amount of CGIs. (Orange stars) Transition point from which +1 nucleosome densities switch from a correlation to an anti-correlation pattern with GC content. (B) Correlation of CpG peak length and aNDR size within CGI-rich groups. A linear regression of CGI length versus nucleosome occupancy, divided into 80 classes, shows a high correlation (R = 0.91). (C) GC content correlate (in GC-low areas) and anti-correlate in GC-rich areas with MNase signal at +1 nucleosome proximity. Promoters were divided into 80 equal groups of increasing +1 GC content and plotted against MNase signal. Nucleosome density increases and then decreases after a 0.58 GC content threshold. (D) Transitions in the major nucleosome occupancy from position +1 to +4 with increasing GC content. Occupancy levels for +1 to +4 nucleosomes were measured around the midpoint position calculated on all promoters.

