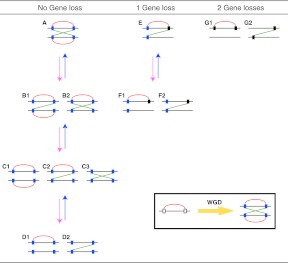
Figure 2.
Retained network patterns in a paired gene cluster after gene and/or PPI losses. Rectangles and horizontal lines represent genes and chromosomes, respectively. Red and green lines indicate cis- and trans-PPIs, respectively. (White rectangles) Genes before they experienced WGD. Blue and black rectangles show extant-paired ohnologs and singletons, respectively. Pink and blue arrows indicate PPI losses and gains during evolution, respectively. All possible scenarios that retain at least one PPI are shown.

