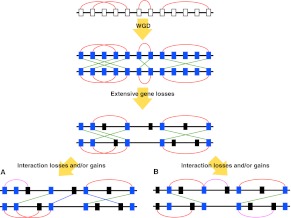
Figure 4.
PPIs losses and gains after whole genome duplication (WGD). Rectangles and horizontal lines represent genes and chromosomes, respectively. Red and green lines indicate cis- and trans-PPIs, respectively. (White rectangles) Genes prior to WGD. Blue and black rectangles show extant-paired ohnologs and singletons, respectively. Pink and blue lines indicate newly created cis- and trans-PPIs of ohnologs, respectively. As a matter of convenience, PPI losses and gains are shown after gene losses; however, the events may occur simultaneously in the evolutionary process. (A) Random PPI dynamics model. Some PPIs among ohnologs disappeared and/or appeared randomly after WGD. Trans-PPIs are observed as often as cis-ones. (B) Biased PPI dynamics model. PPIs among ohnologs in the same paralogon are retained preferentially after PPI losses. In addition, new interacting clusters are created by PPI rewiring. The number of cis-PPIs is larger than that of trans-PPIs.

